PROYECCION FUTURA, BASADA EN UN MODELO PARAMETRICO PARA LA EXTRAPOLACION TEMPORAL DE LOS CASOS CONFIRMADOS Y ACUMULADOS-DIARIOS DE SARS-CoV-2, TOTALES PARA ESPAÑA
https://www.lavanguardia.com/vida/20200316/474173678153/coronavirus-covid-19-estacional-trilla.html

04/05/2020
Recerca
Providing the authorities with information of the short-term behaviour of several variables on the spread of SARS-CoV-2 is the main goal of an initiative promoted by the Spanish Committee for Mathematics (CEMAT) in which several experts from the University of Barcelona are taking part.
With this aim, CEMAT calls all researchers who are interested in collaborating in this collective intelligence task and fight against the COVID-19 health crisis. Predictions by main researchers will contribute to make a cooperative predictor based on optimized combinations of predictions from different mathematic models disaggregated by autonomous communities. As part of this initiative, the precision of predictions will be evaluated according to the official database made by the Health Institute Carlos III.
Regarding the UB research field, participants in the initiative are the COVID-19 Prediction Group, led by the lecturer of the Faculty of Biology Antoni Monleón Getino, member of the Research Group on Biostatistics and Bioinformatics (GRBIO) -integrated in the platform Bioinformatics Barcelona (BIB)-, and the lecturer Jaume Canela Soler, from the Department of Basic Clinical Practice of the Faculty of Medicine and Health Sciences of the UB, and the Research Group on Risk in Insurance and Finance (RISKCENTER), led by Professor Montserrat Guillén, from the Department of Econometrics, Statistics, and Applied Economics of the Faculty of Economics and Business of the UB.
Created in 2004, CEMAT is an entity aimed to coordinate the mathematical activity in Spain related to the International Mathematical Union (IMU) and to promote the representation of the country in international mathematical organizations.


VARIABLES: DESCRIPCION DE LAS VARIABLES: nuevos = casos nuevos de ese dia totales (Total cases predicted) nuevos.100hab: casos nuevos por 100000 hab p.Hosp.100hab: pacientes hospitalizados por 100000 hab UCI.100hab : pacientes UCI por 100000 hab deathth.100hab: pacientes fallecidos por 100000 hab Recup.100hab: pacientes recuperados por 100000 hab


VARIABLES: DESCRIPCION DE LAS VARIABLES: nuevos = casos nuevos de ese dia totales (Total cases predicted) nuevos.100hab: casos nuevos por 100000 hab p.Hosp.100hab: pacientes hospitalizados por 100000 hab UCI.100hab : pacientes UCI por 100000 hab deathth.100hab: pacientes fallecidos por 100000 hab Recup.100hab: pacientes recuperados por 100000 hab


VARIABLES: DESCRIPCION DE LAS VARIABLES: nuevos = casos nuevos de ese dia totales (Total cases predicted) nuevos.100hab: casos nuevos por 100000 hab p.Hosp.100hab: pacientes hospitalizados por 100000 hab UCI.100hab : pacientes UCI por 100000 hab deathth.100hab: pacientes fallecidos por 100000 hab Recup.100hab: pacientes recuperados por 100000 hab


VARIABLES: DESCRIPCION DE LAS VARIABLES: nuevos = casos nuevos de ese dia totales (Total cases predicted) nuevos.100hab: casos nuevos por 100000 hab p.Hosp.100hab: pacientes hospitalizados por 100000 hab UCI.100hab : pacientes UCI por 100000 hab deathth.100hab: pacientes fallecidos por 100000 hab Recup.100hab: pacientes recuperados por 100000 hab


Date.NextDays nuevos totales nuevos.100hab
57 2020-04-17 3968 192034 8
58 2020-04-18 3640 195674 8
59 2020-04-19 3341 199015 7
60 2020-04-20 3166 202181 7
61 2020-04-21 3052 205233 7
62 2020-04-22 2968 208201 6
VARIABLES:
DESCRIPCION DE LAS VARIABLES:
nuevos = casos nuevos de ese dia
totales (Total cases predicted)
nuevos.100hab: casos nuevos por 100000 hab
p.Hosp.100hab: pacientes hospitalizados por 100000 hab
UCI.100hab : pacientes UCI por 100000 hab
deathth.100hab: pacientes fallecidos por 100000 hab
Recup.100hab: pacientes recuperados por 100000 hab


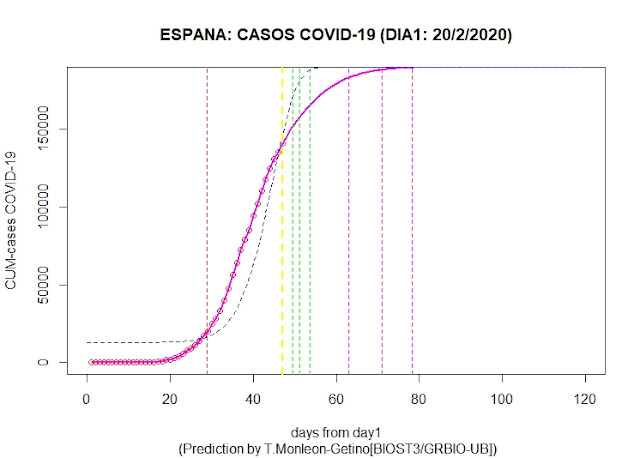
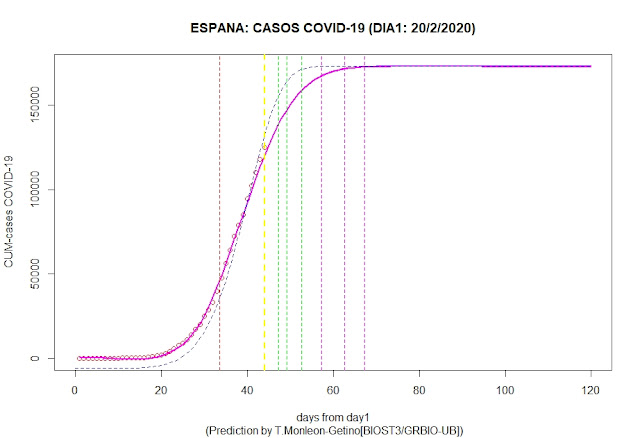
 Vertical
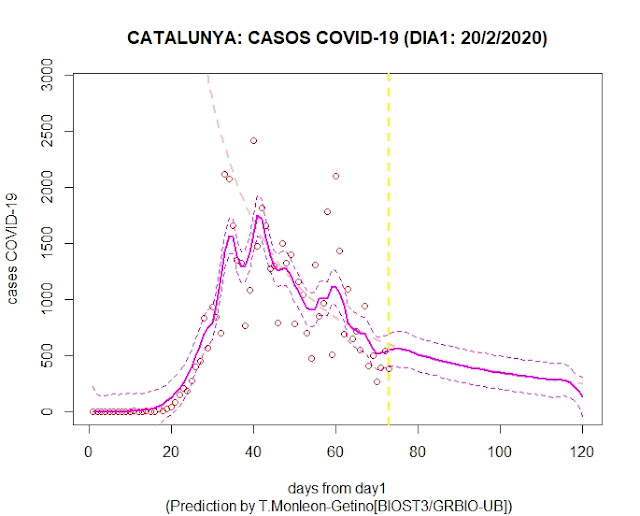
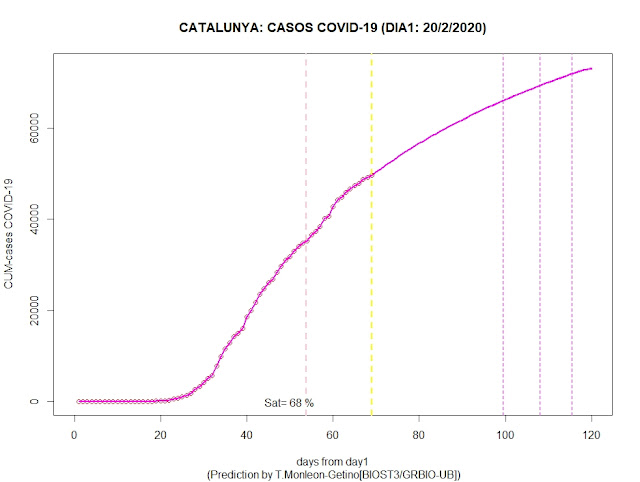
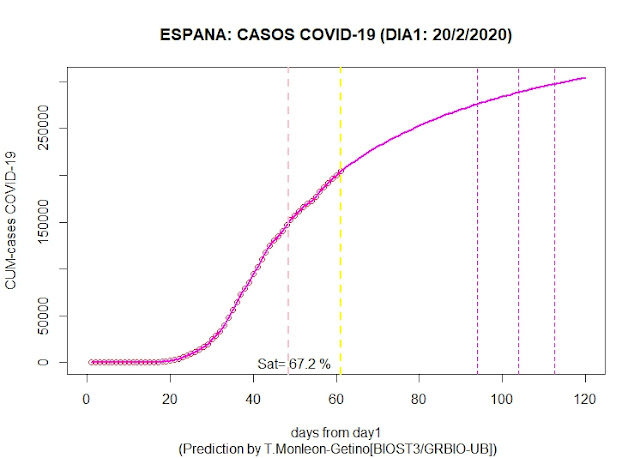
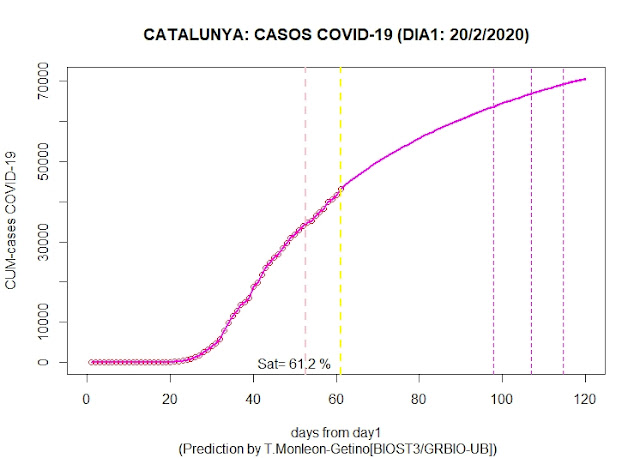
yellow line: today, magenta lines: days to reach
maximum number of cases (90, 95 and 99%) using a non parametric method.
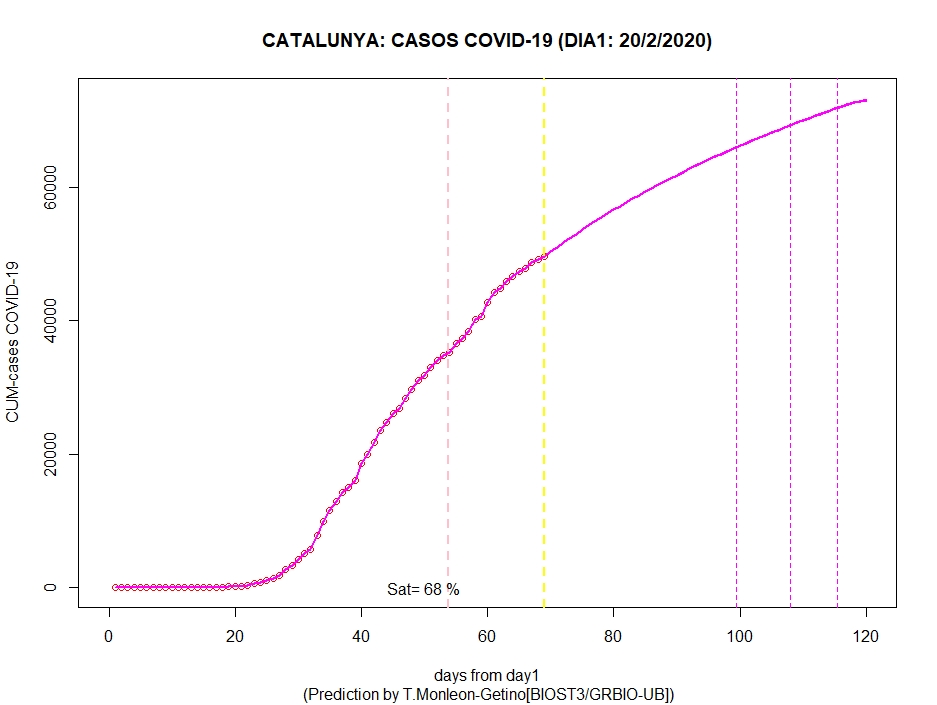
Sat = % saturation (percentage of maximum cases currently)
Vertical
yellow line: today, magenta lines: days to reach
maximum number of cases (90, 95 and 99%) using a non parametric method.
Sat = % saturation (percentage of maximum cases currently)


 Vertical
yellow line: today, magenta lines: days to reach
maximum number of cases (90, 95 and 99%) using a non parametric method.
Sat = % saturation (percentage of maximum cases currently)
Vertical
yellow line: today, magenta lines: days to reach
maximum number of cases (90, 95 and 99%) using a non parametric method.
Sat = % saturation (percentage of maximum cases currently)


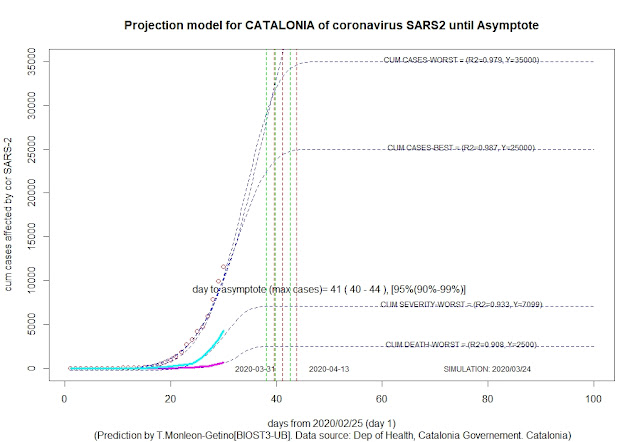
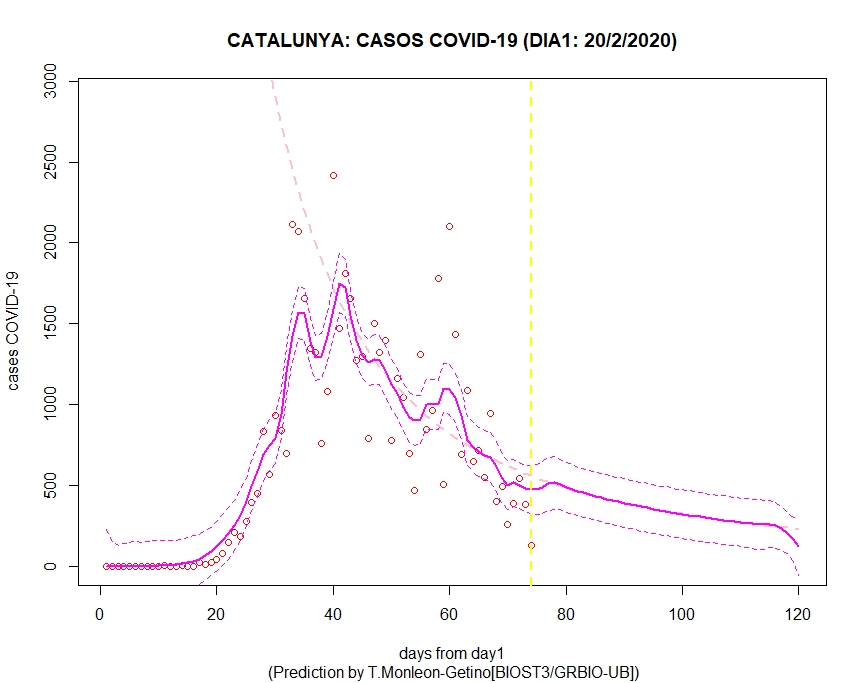
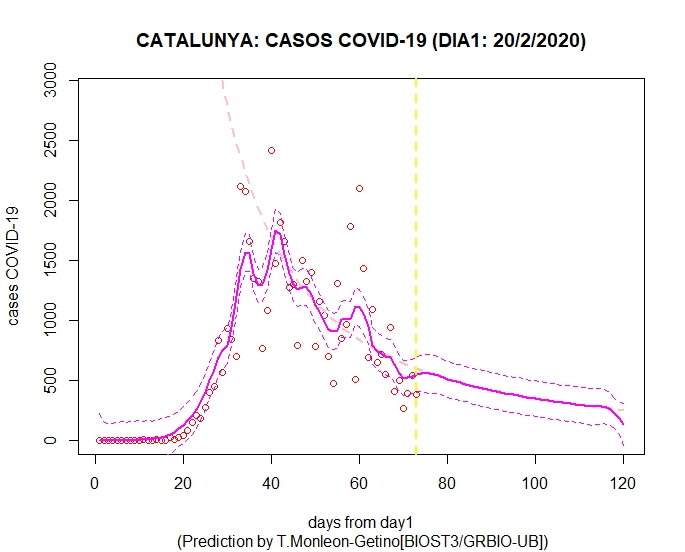
Cases in Catalonia projection:


# VARIABLES:


"Maximum number of accumulated cases. Mean=26135,CI95% = (26021-26374)" "Parameters cum cases W(X). c=-13.6,d=3.9, day90%=42, day95%=45, day99%=50"
Cum Cases for the next days:
Cases for the next days:
Total cases prediction for next days (Catalonia)


Total cases prediction for next days (Catalonia)


Total cases prediction for next days (Catalonia)
Cases per 100000 citizens prediction for next days (Catalonia)
Efron.r.squared=1 (parametric model coefficient of determination)

Total cases prediction for next days (Catalonia)


Total cases prediction for next days (Catalonia)

 red: real cases, magenta: predicted cases (with CI95%), cyan: real cum
deaths , blue: predicted cum deaths, yellow: real deaths.
red: real cases, magenta: predicted cases (with CI95%), cyan: real cum
deaths , blue: predicted cum deaths, yellow: real deaths.

Prediction of number of cases for the next days:

Dayly predictions for the next days in Catalonia: 24/3, 25/3, 26/3, ..
Yellow marker: maximum expected 1/4/20 - 4/4/20
Total cases prediction for next days (Catalonia)
red line: worst scenario (Cases next days: 1847 2116 2397 2685 2973 3251 3508 3733 3913 4036 4092 4072 3971 3790 3534 3213 2842 2441 2031 1632 1265 941 671 457 296 182 105 58 29 14 6 3)
magenta line: average scenario (worst-best scenarios) (Cases next days: 1274 1314 1446 1555 1658 1751 1830 1892 1931 1944 1929 1884 1808 1702 1571 1418 1252 1079 907 744 595 466 358 271 203 153 115 88 68 54 42 33)
Cases per 100000 citizens prediction for next days (Catalonia)
red line: worst scenario (Cases next days: 25 28 32 36 40 43 47 50 52 54 55 54 53 51 47 43 38 33 27 22 17 13 9 6 4 2 1 1 0 0 0 0 0 0 0 0 0 0 0 0 0 0 0 0 0 0 0 0 0 0 0 0
[53] 0 0 0 0 0 0 0 0 0 0 0 0 0 0 0 0 0 0 0 0 0 )
magenta line: average scenario (worst-best scenarios) (Cases next days: 17 18 19 21 22 23 24 25 26 26 26 25 24 23 21 19 17 14 12 10 8 6 5 4 3 2 2 1 1 1 1 0 0 0 0 0 0 0 0 0 0 0 0 0 0 0 0 0 0 0 0 0 0 0 0 0 0 0 0 0 0 0 0 0 0 0 0 0 0 0 0 0 )
Severity Cases per 100000 citizens prediction for next days (Catalonia)
red line: worst scenario (Cases next days: 2 3 4 5 7 8 9 10 11 12 12 12 11 11 9 8 6 4 2 1 0 0 0 0 0 0 0 0 0 0 0 0 0 0 0 0)
magenta line: average scenario (worst-best scenarios) (Cases next days: 0 0 0 0 1 1 1 2 2 2 2 2 1 1 0 0 0 0 0 0 0 0 0 0 0 0 0 0 )
⇢DAY: 2020/3/22 extraordinary measures in Spain


MORE INFORMATION OF PREDICTION, MODELS ABOUT CORONAVIRUS IN SPAIN
2020/03/16

Consult daily data in: https://www.epdata.es/datos/coronavirus-china-datos-graficos/498
Tots els mapes per seguir l'evolució del coronavirus a Catalunya, Espanya i el món - http://ara.cat/_90009a4c?s=e
Catalonia data of cases, deaths and severity. https://www.naciodigital.cat/noticia/198469/grafic/interactiu/aixi/evoluciona/coronavirus/catalunya/dia/dia
Wikipedia. Coronavirus in Spain. https://en.wikipedia.org/wiki/2020_coronavirus_pandemic_in_Spain
Institute Superiori di Sanita. Statistics of Coronavirus in Italy (Statrification by age and sex):. https://en.wikipedia.org/wiki/Template:2019%E2%80%9320_coronavirus_pandemic_data/Italy_medical_cases
03/05/2020:
Si analizamos los datos en conjunto, todo ello resulta en una mortalidad general del 2,3%, una cifra que se alinea con los datos que ya se venían manejando. No obstante, La Organización Mundial de la Salud (OMS) ha informado que esa tasa de mortalidad se corresponde más con la realidad de Wuhan que con la del resto del mundo, donde el índice se queda en un 0,7%."
2020/03/18. Climical trial solidarity WHO. What is the best strategy to stop coronavirus? https://www.elperiodico.com/es/sociedad/20200318/ensayo-clinico-mundial-tratamiento-mas-eficaz-coronavirus-7895656
https://www.lavanguardia.com/vida/20200318/474249568746/oms-marcha-ensayo-clinico-mundial-tratamiento-eficaz-coronavirus.html
2020/03/17: Imperial College of London prediction https://elpais.com/ciencia/2020-03-17/un-informe-advierte-de-que-las-medidas-de-distanciamiento-social-podrian-ser-necesarias-hasta-18-meses.html
https://www.imperial.ac.uk/media/imperial-college/medicine/sph/ide/gida-fellowships/Imperial-College-COVID19-NPI-modelling-16-03-2020.pdf
2020/03/17:Report of the WHO-China Joint Mission on Coronavirus Disease 2019 (COVID-19) https://www.who.int/docs/default-source/coronaviruse/who-china-joint-mission-on-covid-19-final-report.pdf
More cases than confirmed,

2020/03/17: New paper in Scence (Thanks Noelia Fernandez and Jordi García !)
https://science.sciencemag.org/content/early/2020/03/13/science.abb3221
2020/03/16: Temporal variation in transmission during the COVID-19 outbreak - Centre for Mathematical Modelling of Infectious Diseases
https://cmmid.github.io/topics/covid19/current-patterns-transmission/global-time-varying-transmission.html


2020/03/15 Prediction coronavirus using Kalman filter: https://towardsdatascience.com/using-kalman-filter-to-predict-corona-virus-spread-72d91b74cc8
2020/03/16:https://www.nytimes.com/2020/03/01/health/coronavirus-washington-spread.html


REFERENCES
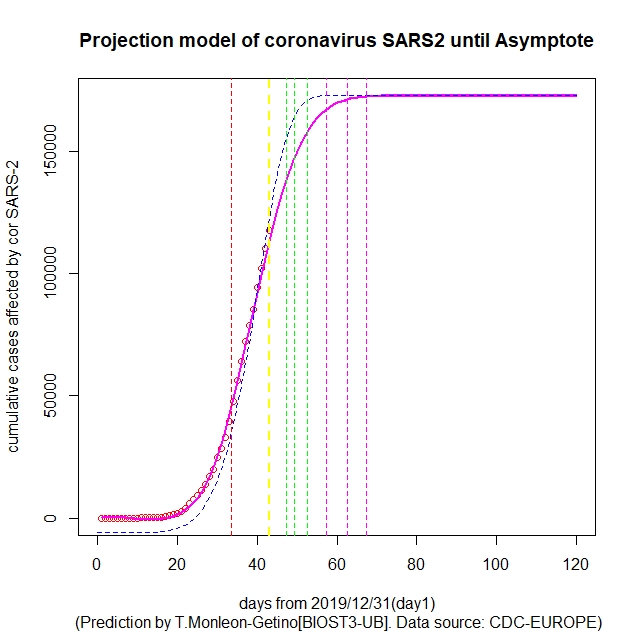
DAILY FUTURE PROJECTION, BASED ON A PARAMETRIC MODEL FOR THE TEMPORARY EXTRAPOLATION OF THE CONFIRMED AND ACCUMULATED-DAILY CASES OF SARS-CoV-2, TOTAL FOR SPAIN
Grupo de predicción COVID-19, Universidad de Barcelona (Facultad de Medicina, Facultad de Biología).
Antonio Monleon-Getino1,
3, 4, Jaume Canela-Soler2
1.Section of Statistics,
Departament of Genetics, Microbiology and Statistics, Faculty of Biology,
Univeristy of Barcelona, Barcelona, Spain
2.Section of Biostatistics. Clinical Foundations
Department, School of Medicine, Univeristy of Barcelona, Barcelona, Spain
3.Group of Researh in
Bioestatistics and Bioinformatics (GRBIO) , Barcelona, Spain
4.BIOST3. Group of
Researh in Clinical Bioestatistics, Bioinformatics and Data Science, Barcelona,
Spain
Email address: amonleong@ub.edu; jcanela@ub.eduThis model is based on the study: Next weeks of SARS-CoV-2: Projection model to predict time evolution scenarios of accumulated cases in Spain. Antonio Monleon-Getino, Jaume Canela-Soler. 2020 (pending of publication). For the computations we use library BDBiost3 (https://github.com/amonleong/BDSbiost3)BDSbiost3: Machine learning and advanced statistical methods for omic, categorical analysis and others. Library for R published in Github.
14/04/2020: See preprint in https://medrxiv.org/cgi/content/short/2020.04.09.20059881v1 Monleón Getino T, Canela-Soler J. (2020) Next weeks of SARS-CoV-2: Projection model to predict time evolution scenarios of accumulated cases in Spain MEDRXIV https://doi.org/10.1101/2020.04.09.20059881doi
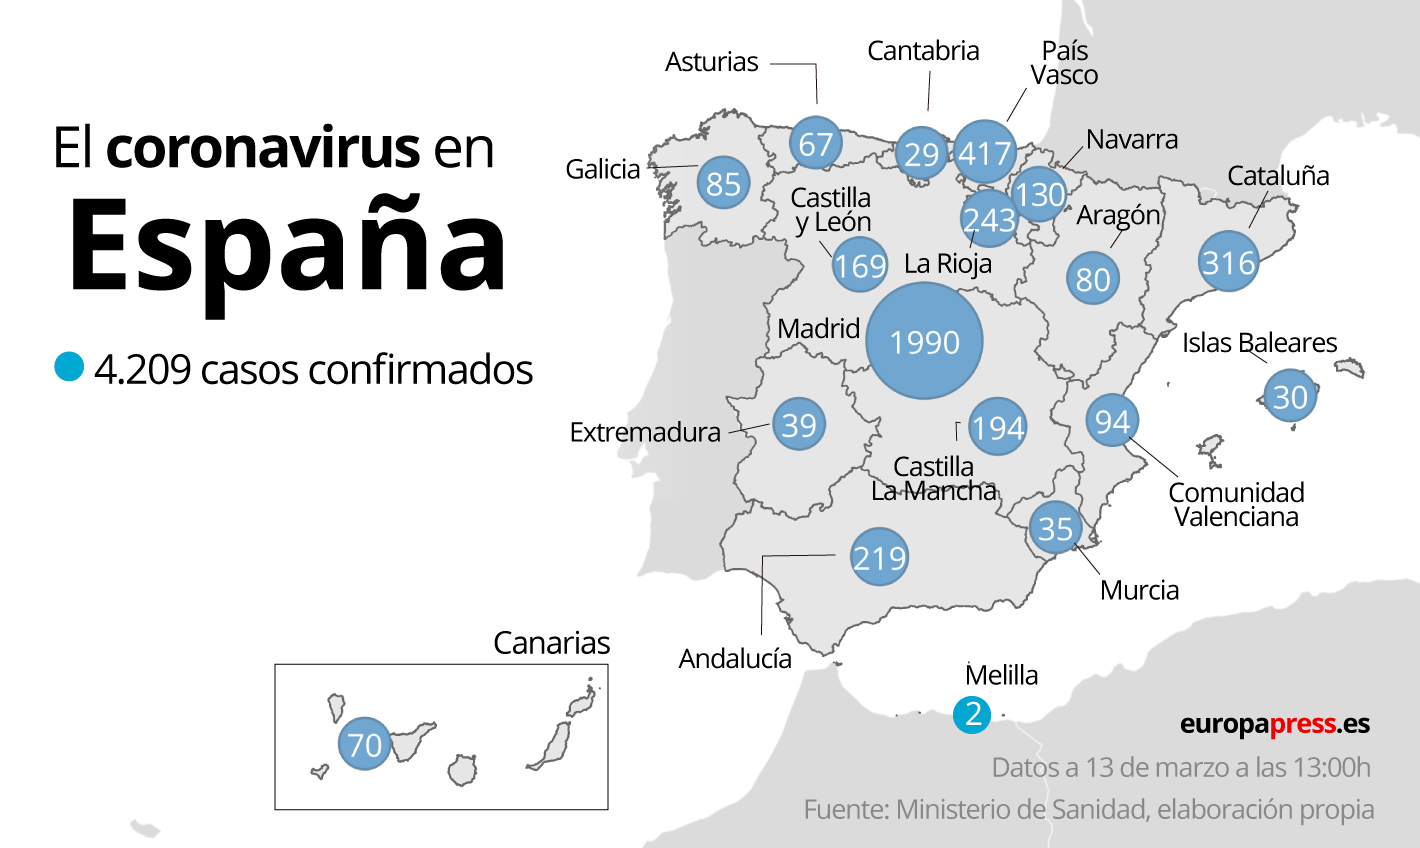
Update of data on the total number of accumulated cases affected by SARS-CoV-2 confirmed in Spain.
Providing the authorities with information of the short-term behaviour of several variables on the spread of SARS-CoV-2 is the main goal of an initiative promoted by the Spanish Committee for Mathematics (CEMAT) in which several experts from the University of Barcelona are taking part.
With this aim, CEMAT calls all researchers who are interested in collaborating in this collective intelligence task and fight against the COVID-19 health crisis. Predictions by main researchers will contribute to make a cooperative predictor based on optimized combinations of predictions from different mathematic models disaggregated by autonomous communities. As part of this initiative, the precision of predictions will be evaluated according to the official database made by the Health Institute Carlos III.
Regarding the UB research field, participants in the initiative are the COVID-19 Prediction Group, led by the lecturer of the Faculty of Biology Antoni Monleón Getino, member of the Research Group on Biostatistics and Bioinformatics (GRBIO) -integrated in the platform Bioinformatics Barcelona (BIB)-, and the lecturer Jaume Canela Soler, from the Department of Basic Clinical Practice of the Faculty of Medicine and Health Sciences of the UB, and the Research Group on Risk in Insurance and Finance (RISKCENTER), led by Professor Montserrat Guillén, from the Department of Econometrics, Statistics, and Applied Economics of the Faculty of Economics and Business of the UB.
Created in 2004, CEMAT is an entity aimed to coordinate the mathematical activity in Spain related to the International Mathematical Union (IMU) and to promote the representation of the country in international mathematical organizations.
PREDICTIONS
2020/04/02: Our research group (BIOST ·, GRBIO) subscribes to the cooperative covid19 forecasting initiative promoted by the CEMat (see http://matematicas.uclm.es/cemat/covid19/wp-content/uploads/sites/2/2020/04/Prediccion_cooperativa.pdf)
⇢DAY: 2020/5/09 extraordinary(+) measures in Spain
Algorithm variation(*slow regression-2)
Efron.r.squared>0.9 (parametric model coefficient of determination)
data from https://covid19.isciii.es/
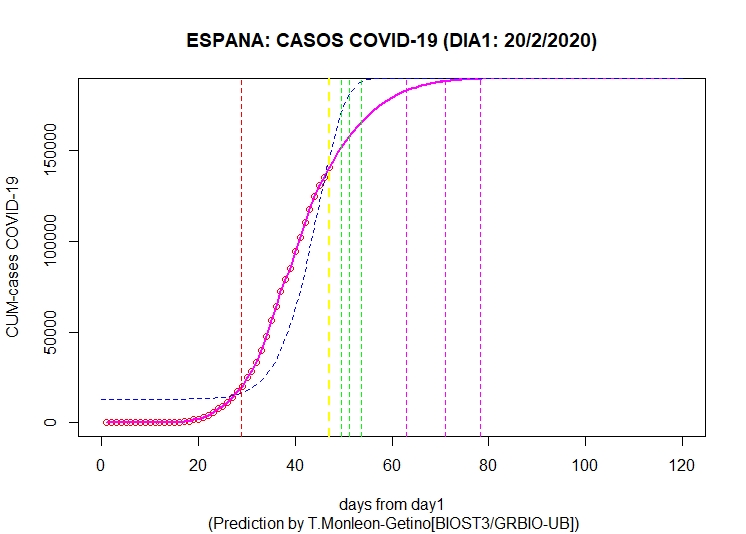
Cases in Spain projection:
Vertical yellow line: today, magenta lines: days to reach maximum number of cases (90, 95 and 99%) using a non parametric method. Sat = % saturation (percentage of maximum cases currently)Date.NextDays nuevos totales nuevos.100hab p.Hosp.100hab p.UCI.100hab p.death.100hab p.Recup.100hab 81 2020-05-09 2118 266781 4 3 0 0 5 82 2020-05-10 2055 268836 4 3 0 0 4 83 2020-05-11 2039 270875 4 3 0 0 4 84 2020-05-12 2026 272901 4 3 0 0 4 85 2020-05-13 2007 274908 4 3 0 0 4 86 2020-05-14 1967 276875 4 3 0 0 4 87 2020-05-15 1923 278798 4 3 0 0 4VARIABLES: DESCRIPCION DE LAS VARIABLES: nuevos = casos nuevos de ese dia totales (Total cases predicted) nuevos.100hab: casos nuevos por 100000 hab p.Hosp.100hab: pacientes hospitalizados por 100000 hab UCI.100hab : pacientes UCI por 100000 hab deathth.100hab: pacientes fallecidos por 100000 hab Recup.100hab: pacientes recuperados por 100000 habCases in Catalonia projection:
Vertical yellow line: today, magenta lines: days to reach maximum number of cases (90, 95 and 99%) using a non parametric method. Sat = % saturation (percentage of maximum cases currently)STATISTICAL TABLES:
Date.NextDays nuevos totales nuevos.100hab p.Hosp.100hab p.UCI.100hab p.death.100hab p.Recup.100hab 81 2020-05-09 402 54131 5 3 0 1 5 82 2020-05-10 396 54527 5 3 0 1 5 83 2020-05-11 405 54932 5 3 0 1 5 84 2020-05-12 415 55347 6 3 0 1 5 85 2020-05-13 412 55759 5 3 0 1 5 86 2020-05-14 400 56159 5 3 0 1 5 87 2020-05-15 388 56547 5 3 0 1 5VARIABLES: DESCRIPCION DE LAS VARIABLES: nuevos = casos nuevos de ese dia totales (Total cases predicted) nuevos.100hab: casos nuevos por 100000 hab p.Hosp.100hab: pacientes hospitalizados por 100000 hab UCI.100hab : pacientes UCI por 100000 hab deathth.100hab: pacientes fallecidos por 100000 hab Recup.100hab: pacientes recuperados por 100000 hab


⇢DAY: 2020/5/06 extraordinary(+) measures in Spain

Algorithm variation(*slow regression-2)

Efron.r.squared>0.9 (parametric model coefficient of determination)

data from https://covid19.isciii.es/


Cases in Spain projection:


 Vertical yellow line: today,  magenta lines: days to reach maximum number of cases (90, 95 and 99%) using a non parametric method. Sat = % saturation (percentage of maximum cases currently)


   Date.NextDays nuevos totales nuevos.100hab p.Hosp.100hab p.UCI.100hab p.death.100hab p.Recup.100hab
77    2020-05-06   2345  256027             5             4            0              1              5
78    2020-05-07   2355  258382             5             4            0              1              4
79    2020-05-08   2283  260665             5             4            0              1              4
80    2020-05-09   2195  262860             5             4            0              0              4
81    2020-05-10   2117  264977             4             4            0              0              4
82    2020-05-11   2067  267044             4             4            0              0              4
83    2020-05-12   2027  269071             4             4            0              0              4


VARIABLES:
DESCRIPCION DE LAS VARIABLES:
nuevos = casos nuevos de ese dia
totales (Total cases predicted)
nuevos.100hab: casos nuevos por 100000 hab
p.Hosp.100hab: pacientes hospitalizados por 100000 hab
UCI.100hab : pacientes UCI por 100000 hab
deathth.100hab: pacientes fallecidos por 100000 hab
Recup.100hab: pacientes recuperados por 100000 hab


Cases in Catalonia projection:


 Vertical yellow line: today,  magenta lines: days to reach maximum number of cases (90, 95 and 99%) using a non parametric method. Sat = % saturation (percentage of maximum cases currently)


STATISTICAL TABLES:

   Date.NextDays nuevos totales nuevos.100hab p.Hosp.100hab p.UCI.100hab p.death.100hab p.Recup.100hab
77    2020-05-06    459   52549             6             4            0              1              6
78    2020-05-07    477   53026             6             4            0              1              5
79    2020-05-08    480   53506             6             3            0              1              6
80    2020-05-09    473   53979             6             3            0              1              6
81    2020-05-10    463   54442             6             3            0              1              5
82    2020-05-11    449   54891             6             3            0              1              5
83    2020-05-12    437   55328             6             3            0              1              5


VARIABLES: DESCRIPCION DE LAS VARIABLES: nuevos = casos nuevos de ese dia totales (Total cases predicted) nuevos.100hab: casos nuevos por 100000 hab p.Hosp.100hab: pacientes hospitalizados por 100000 hab UCI.100hab : pacientes UCI por 100000 hab deathth.100hab: pacientes fallecidos por 100000 hab Recup.100hab: pacientes recuperados por 100000 hab


⇢DAY: 2020/5/05 extraordinary(+) measures in Spain
Algorithm variation(*slow regression-2)
Efron.r.squared>0.9 (parametric model coefficient of determination)
data from https://covid19.isciii.es/
Cases in Spain projection:
Vertical yellow line: today, magenta lines: days to reach maximum number of cases (90, 95 and 99%) using a non parametric method. Sat = % saturation (percentage of maximum cases currently)
Date.NextDays nuevos totales nuevos.100hab p.Hosp.100hab p.UCI.100hab p.death.100hab p.Recup.100hab 76 2020-05-05 2102 252663 4 4 0 1 5 77 2020-05-06 2187 254850 5 4 0 1 5 78 2020-05-07 2219 257069 5 4 0 1 4 79 2020-05-08 2199 259268 5 4 0 1 4 80 2020-05-09 2141 261409 5 4 0 0 4 81 2020-05-10 2076 263485 4 4 0 0 4 82 2020-05-11 2023 265508 4 4 0 0 4VARIABLES: DESCRIPCION DE LAS VARIABLES: nuevos = casos nuevos de ese dia totales (Total cases predicted) nuevos.100hab: casos nuevos por 100000 hab p.Hosp.100hab: pacientes hospitalizados por 100000 hab UCI.100hab : pacientes UCI por 100000 hab deathth.100hab: pacientes fallecidos por 100000 hab Recup.100hab: pacientes recuperados por 100000 habCases in Catalonia projection:
Vertical yellow line: today, magenta lines: days to reach maximum number of cases (90, 95 and 99%) using a non parametric method. Sat = % saturation (percentage of maximum cases currently)STATISTICAL TABLES:
Date.NextDays nuevos totales nuevos.100hab p.Hosp.100hab p.UCI.100hab p.death.100hab p.Recup.100hab 76 2020-05-05 472 52270 6 4 0 1 7 77 2020-05-06 495 52765 7 4 0 1 6 78 2020-05-07 507 53272 7 4 0 1 5 79 2020-05-08 500 53772 7 3 0 1 6 80 2020-05-09 486 54258 6 3 0 1 6 81 2020-05-10 470 54728 6 3 0 1 6 82 2020-05-11 458 55186 6 3 0 1 5VARIABLES: DESCRIPCION DE LAS VARIABLES: nuevos = casos nuevos de ese dia totales (Total cases predicted) nuevos.100hab: casos nuevos por 100000 hab p.Hosp.100hab: pacientes hospitalizados por 100000 hab UCI.100hab : pacientes UCI por 100000 hab deathth.100hab: pacientes fallecidos por 100000 hab Recup.100hab: pacientes recuperados por 100000 hab


⇢DAY: 2020/5/04 extraordinary(+) measures in Spain
Algorithm variation(*slow regression-2)
Efron.r.squared>0.9 (parametric model coefficient of determination)
data from https://covid19.isciii.es/
Cases in Spain projection:

Vertical yellow line: today, magenta lines: days to reach maximum number of cases (90, 95 and 99%) using a non parametric method. Sat = % saturation (percentage of maximum cases currently)
STATISTICAL TABLES:
Date.NextDays nuevos totales nuevos.100hab p.Hosp.100hab p.UCI.100hab p.death.100hab p.Recup.100hab 75 2020-05-04 2072 250373 4 4 0 1 5 76 2020-05-05 2153 252526 5 4 0 1 5 77 2020-05-06 2238 254764 5 4 0 1 5 78 2020-05-07 2254 257018 5 4 0 1 4 79 2020-05-08 2217 259235 5 4 0 1 4 80 2020-05-09 2147 261382 5 4 0 1 4 81 2020-05-10 2082 263464 4 4 0 0 4VARIABLES: DESCRIPCION DE LAS VARIABLES: nuevos = casos nuevos de ese dia totales (Total cases predicted) nuevos.100hab: casos nuevos por 100000 hab p.Hosp.100hab: pacientes hospitalizados por 100000 hab UCI.100hab : pacientes UCI por 100000 hab deathth.100hab: pacientes fallecidos por 100000 hab Recup.100hab: pacientes recuperados por 100000 habCases in Catalonia projection:
Vertical yellow line: today, magenta lines: days to reach maximum number of cases (90, 95 and 99%) using a non parametric method. Sat = % saturation (percentage of maximum cases currently)STATISTICAL TABLES:
Date.NextDays nuevos totales nuevos.100hab p.Hosp.100hab p.UCI.100hab p.death.100hab p.Recup.100hab 75 2020-05-04 475 51868 6 3 0 1 8 76 2020-05-05 489 52357 7 3 0 1 7 77 2020-05-06 511 52868 7 3 0 1 6 78 2020-05-07 518 53386 7 3 0 1 5 79 2020-05-08 508 53894 7 3 0 1 5 80 2020-05-09 491 54385 7 3 0 1 5 81 2020-05-10 475 54860 6 3 0 1 5VARIABLES: DESCRIPCION DE LAS VARIABLES: nuevos = casos nuevos de ese dia totales (Total cases predicted) nuevos.100hab: casos nuevos por 100000 hab p.Hosp.100hab: pacientes hospitalizados por 100000 hab UCI.100hab : pacientes UCI por 100000 hab deathth.100hab: pacientes fallecidos por 100000 hab Recup.100hab: pacientes recuperados por 100000 hab


⇢DAY: 2020/5/02 extraordinary(+) measures in Spain
Algorithm variation(*slow regression-2)
Efron.r.squared>0.9 (parametric model coefficient of determination)
data from https://covid19.isciii.es/
Cases in Spain projection:


Vertical yellow line: today, magenta lines: days to reach maximum number of cases (90, 95 and 99%) using a non parametric method. Sat = % saturation (percentage of maximum cases currently)
STATISTICAL TABLES:
   Date.NextDays nuevos totales nuevos.100hab p.Hosp.100hab p.UCI.100hab p.death.100hab p.Recup.100hab
74    2020-05-02   2332  249454             5             4            0              1              5
75    2020-05-03   2323  251777             5             4            0              1              5
76    2020-05-04   2354  254131             5             4            0              1              5
77    2020-05-05   2365  256496             5             4            0              1              5
78    2020-05-06   2326  258822             5             4            0              1              4
79    2020-05-07   2262  261084             5             4            0              1              4
80    2020-05-08   2201  263285             5             4            0              1              4
VARIABLES:
DESCRIPCION DE LAS VARIABLES:
nuevos = casos nuevos de ese dia
totales (Total cases predicted)
nuevos.100hab: casos nuevos por 100000 hab
p.Hosp.100hab: pacientes hospitalizados por 100000 hab
UCI.100hab : pacientes UCI por 100000 hab
deathth.100hab: pacientes fallecidos por 100000 hab
Recup.100hab: pacientes recuperados por 100000 hab
Cases in Catalonia projection:

Vertical
yellow line: today, magenta lines: days to reach maximum number of
cases (90, 95 and 99%) using a non parametric method. Sat = % saturation
(percentage of maximum cases currently)
STATISTICAL TABLES:
   Date.NextDays nuevos totales nuevos.100hab p.Hosp.100hab p.UCI.100hab p.death.100hab p.Recup.100hab
74    2020-05-02    558   51819             7             3            0              1              5
75    2020-05-03    559   52378             7             4            0              1              5
76    2020-05-04    555   52933             7             4            0              1              5
77    2020-05-05    548   53481             7             4            0              1              4
78    2020-05-06    537   54018             7             3            0              1              4
79    2020-05-07    523   54541             7             3            0              1              4
80    2020-05-08    510   55051             7             3            0              1              4
VARIABLES: DESCRIPCION DE LAS VARIABLES: nuevos = casos nuevos de ese dia totales (Total cases predicted) nuevos.100hab: casos nuevos por 100000 hab p.Hosp.100hab: pacientes hospitalizados por 100000 hab UCI.100hab : pacientes UCI por 100000 hab deathth.100hab: pacientes fallecidos por 100000 hab Recup.100hab: pacientes recuperados por 100000 hab
⇢DAY: 2020/5/01 extraordinary(+) measures in Spain
Algorithm variation(*slow regression-2)
Efron.r.squared>0.9 (parametric model coefficient of determination)
data from https://covid19.isciii.es/
Cases in Spain projection:


Vertical yellow line: today, magenta lines: days to reach maximum number of cases (90, 95 and 99%) using a non parametric method. Sat = % saturation (percentage of maximum cases currently)
STATISTICAL TABLES:
   Date.NextDays nuevos totales nuevos.100hab p.Hosp.100hab p.UCI.100hab p.death.100hab p.Recup.100hab
72    2020-05-01   2807  245795             6             5            0              1              5
73    2020-05-02   2682  248477             6             5            0              1              5
74    2020-05-03   2577  251054             5             5            0              1              5
75    2020-05-04   2495  253549             5             5            0              1              5
76    2020-05-05   2422  255971             5             5            0              1              5
77    2020-05-06   2355  258326             5             5            0              1              5
78    2020-05-07   2290  260616             5             5            0              1              5
VARIABLES:
DESCRIPCION DE LAS VARIABLES:
nuevos = casos nuevos de ese dia
totales (Total cases predicted)
nuevos.100hab: casos nuevos por 100000 hab
p.Hosp.100hab: pacientes hospitalizados por 100000 hab
UCI.100hab : pacientes UCI por 100000 hab
deathth.100hab: pacientes fallecidos por 100000 hab
Recup.100hab: pacientes recuperados por 100000 hab
Cases in Catalonia projection:


Vertical
yellow line: today, magenta lines: days to reach maximum number of
cases (90, 95 and 99%) using a non parametric method. Sat = % saturation
(percentage of maximum cases currently)
STATISTICAL TABLES:
   Date.NextDays nuevos totales nuevos.100hab p.Hosp.100hab p.UCI.100hab p.death.100hab p.Recup.100hab
72    2020-05-01    564   50898             8             4            0              1              5
73    2020-05-02    589   51487             8             4            0              1              5
74    2020-05-03    602   52089             8             4            0              1              5
75    2020-05-04    598   52687             8             4            0              1              5
76    2020-05-05    582   53269             8             4            0              1              5
77    2020-05-06    565   53834             8             4            0              1              5
78    2020-05-07    550   54384             7             4            0              1              4
VARIABLES: DESCRIPCION DE LAS VARIABLES: nuevos = casos nuevos de ese dia totales (Total cases predicted) nuevos.100hab: casos nuevos por 100000 hab p.Hosp.100hab: pacientes hospitalizados por 100000 hab UCI.100hab : pacientes UCI por 100000 hab deathth.100hab: pacientes fallecidos por 100000 hab Recup.100hab: pacientes recuperados por 100000 hab
⇢DAY: 2020/4/30 extraordinary(+) measures in Spain
Algorithm variation(*slow regression-2)
Efron.r.squared>0.9 (parametric model coefficient of determination)
data from https://covid19.isciii.es/
Cases in Spain projection:


Vertical yellow line: today, magenta lines: days to reach maximum number of cases (90, 95 and 99%) using a non parametric method. Sat = % saturation (percentage of maximum cases currently)
STATISTICAL TABLES:
   Date.NextDays nuevos totales nuevos.100hab p.Hosp.100hab p.UCI.100hab p.death.100hab p.Recup.100hab
71    2020-04-30   3109  242476             7             5            0              1              6
72    2020-05-01   2986  245462             6             6            0              1              5
73    2020-05-02   2853  248315             6             7            0              1              5
74    2020-05-03   2775  251090             6             6            0              1              5
75    2020-05-04   2718  253808             6             6            0              1              5
76    2020-05-05   2668  256476             6             6            0              1              5
77    2020-05-06   2613  259089             6             6            0              1              5
VARIABLES:
DESCRIPCION DE LAS VARIABLES:
nuevos = casos nuevos de ese dia
totales (Total cases predicted)
nuevos.100hab: casos nuevos por 100000 hab
p.Hosp.100hab: pacientes hospitalizados por 100000 hab
UCI.100hab : pacientes UCI por 100000 hab
deathth.100hab: pacientes fallecidos por 100000 hab
Recup.100hab: pacientes recuperados por 100000 hab
Cases in Catalonia projection:


Vertical
yellow line: today, magenta lines: days to reach maximum number of
cases (90, 95 and 99%) using a non parametric method. Sat = % saturation
(percentage of maximum cases currently)
STATISTICAL TABLES:
   Date.NextDays nuevos totales nuevos.100hab p.Hosp.100hab p.UCI.100hab p.death.100hab p.Recup.100hab
71    2020-04-30    575   50518             8             4            0              1              6
72    2020-05-01    601   51119             8             4            0              1              6
73    2020-05-02    625   51744             8             4            0              1              5
74    2020-05-03    625   52369             8             4            0              1              5
75    2020-05-04    614   52983             8             4            0              1              5
76    2020-05-05    596   53579             8             4            0              1              5
77    2020-05-06    579   54158             8             4            0              1              5
VARIABLES: DESCRIPCION DE LAS VARIABLES: nuevos = casos nuevos de ese dia totales (Total cases predicted) nuevos.100hab: casos nuevos por 100000 hab p.Hosp.100hab: pacientes hospitalizados por 100000 hab UCI.100hab : pacientes UCI por 100000 hab deathth.100hab: pacientes fallecidos por 100000 hab Recup.100hab: pacientes recuperados por 100000 hab
⇢DAY: 2020/4/29 extraordinary(+) measures in Spain
Algorithm variation(*slow regression-2)
Efron.r.squared>0.9 (parametric model coefficient of determination)
data from https://covid19.isciii.es/
Cases in Spain projection:


Vertical yellow line: today, magenta lines: days to reach maximum number of cases (90, 95 and 99%) using a non parametric method. Sat = % saturation (percentage of maximum cases currently)
STATISTICAL TABLES:
   Date.NextDays nuevos totales nuevos.100hab p.Hosp.100hab p.UCI.100hab p.death.100hab p.Recup.100hab
70    2020-04-29   5151  250723            11             5            1              1              6
71    2020-04-30   4722  255445            10             6            0              1              6
72    2020-05-01   4029  259474             9             8            0              1              5
73    2020-05-02   3522  262996             7             8            0              1              5
74    2020-05-03   3360  266356             7             7            0              1              5
75    2020-05-04   3398  269754             7             7            0              1              5
76    2020-05-05   3453  273207             7             7            0              1              5
VARIABLES:
DESCRIPCION DE LAS VARIABLES:
nuevos = casos nuevos de ese dia
totales (Total cases predicted)
nuevos.100hab: casos nuevos por 100000 hab
p.Hosp.100hab: pacientes hospitalizados por 100000 hab
UCI.100hab : pacientes UCI por 100000 hab
deathth.100hab: pacientes fallecidos por 100000 hab
Recup.100hab: pacientes recuperados por 100000 hab
Cases in Catalonia projection:


Vertical
yellow line: today, magenta lines: days to reach maximum number of
cases (90, 95 and 99%) using a non parametric method. Sat = % saturation
(percentage of maximum cases currently)
STATISTICAL TABLES:
   Date.NextDays nuevos totales nuevos.100hab p.Hosp.100hab p.UCI.100hab p.death.100hab p.Recup.100hab
70    2020-04-29    649   50330             9             4            0              1              6
71    2020-04-30    654   50984             9             4            0              1              6
72    2020-05-01    669   51653             9             4            0              1              5
73    2020-05-02    666   52319             9             4            0              1              5
74    2020-05-03    653   52972             9             4            0              1              5
75    2020-05-04    635   53607             8             4            0              1              5
76    2020-05-05    620   54227             8             4            0              1              5
VARIABLES: DESCRIPCION DE LAS VARIABLES: nuevos = casos nuevos de ese dia totales (Total cases predicted) nuevos.100hab: casos nuevos por 100000 hab p.Hosp.100hab: pacientes hospitalizados por 100000 hab UCI.100hab : pacientes UCI por 100000 hab deathth.100hab: pacientes fallecidos por 100000 hab Recup.100hab: pacientes recuperados por 100000 hab
⇢DAY: 2020/4/28 extraordinary(+) measures in Spain
Algorithm variation(*slow regression-2)
Efron.r.squared>0.9 (parametric model coefficient of determination)
data from https://covid19.isciii.es/
Cases in Spain projection:


Vertical yellow line: today, magenta lines: days to reach maximum number of cases (90, 95 and 99%) using a non parametric method. Sat = % saturation (percentage of maximum cases currently)
STATISTICAL TABLES:
   Date.NextDays nuevos totales nuevos.100hab p.Hosp.100hab p.UCI.100hab p.death.100hab p.Recup.100hab
70    2020-04-28   5151  250723            11             5            1              1              6
71    2020-04-29   4722  255445            10             6            0              1              6
72    2020-04-30   4029  259474             9             8            0              1              5
73    2020-05-01   3522  262996             7             8            0              1              5
74    2020-05-02   3360  266356             7             7            0              1              5
75    2020-05-03   3398  269754             7             7            0              1              5
76    2020-05-04   3453  273207             7             7            0              1              5
VARIABLES:
DESCRIPCION DE LAS VARIABLES:
nuevos = casos nuevos de ese dia
totales (Total cases predicted)
nuevos.100hab: casos nuevos por 100000 hab
p.Hosp.100hab: pacientes hospitalizados por 100000 hab
UCI.100hab : pacientes UCI por 100000 hab
deathth.100hab: pacientes fallecidos por 100000 hab
Recup.100hab: pacientes recuperados por 100000 hab
Cases in Catalonia projection:

Vertical yellow line: today, magenta lines: days to reach maximum number of cases (90, 95 and 99%) using a non parametric method. Sat = % saturation (percentage of maximum cases currently)
STATISTICAL TABLES:
   Date.NextDays nuevos totales nuevos.100hab p.Hosp.100hab p.UCI.100hab p.death.100hab p.Recup.100hab
70    2020-04-28    649   50330             9             4            0              1              6
71    2020-04-29    654   50984             9             4            0              1              6
72    2020-04-30    669   51653             9             4            0              1              5
73    2020-05-01    666   52319             9             4            0              1              5
74    2020-05-02    653   52972             9             4            0              1              5
75    2020-05-03    635   53607             8             4            0              1              5
76    2020-05-04    620   54227             8             4            0              1              5
VARIABLES:
DESCRIPCION DE LAS VARIABLES:
nuevos = casos nuevos de ese dia
totales (Total cases predicted)
nuevos.100hab: casos nuevos por 100000 hab
p.Hosp.100hab: pacientes hospitalizados por 100000 hab
UCI.100hab : pacientes UCI por 100000 hab
deathth.100hab: pacientes fallecidos por 100000 hab
Recup.100hab: pacientes recuperados por 100000 hab
⇢DAY: 2020/4/27 extraordinary(+) measures in Spain
No case data in the official statistics
Catalonia prediction of: 5.37 new cases / 100000 habitantes
Spain prediction of: 3.11 new cases / 100000 habitantes


⇢DAY: 2020/4/23 extraordinary(+) measures in Spain
Algorithm variation(*slow regression-2)
Efron.r.squared>0.9 (parametric model coefficient of determination)
data from https://covid19.isciii.es/
Cases in Spain projection:


Vertical yellow line: today, magenta lines: days to reach maximum number of cases (90, 95 and 99%) using a non parametric method. Sat = % saturation (percentage of maximum cases currently)
STATISTICAL TABLES:
   Date.NextDays nuevos totales nuevos.100hab p.Hosp.100hab p.UCI.100hab p.death.100hab p.Recup.100hab
65    2020-04-24   4058  223820             9             1            0              1              5
66    2020-04-25   3747  227567             8             1            0              1              5
67    2020-04-26   3411  230978             7             1            0              1              5
68    2020-04-27   3195  234173             7             1            0              1              5
69    2020-04-28   3101  237274             7             1            0              1              4
70    2020-04-29   3078  240352             7             1            0              1              4
71    2020-04-30   3028  243380             6             1            0              1              4
VARIABLES:
DESCRIPCION DE LAS VARIABLES:
nuevos = casos nuevos de ese dia
totales (Total cases predicted)
nuevos.100hab: casos nuevos por 100000 hab
p.Hosp.100hab: pacientes hospitalizados por 100000 hab
UCI.100hab : pacientes UCI por 100000 hab
deathth.100hab: pacientes fallecidos por 100000 hab
Recup.100hab: pacientes recuperados por 100000 hab
Cases in Catalonia projection:


Vertical
yellow line: today, magenta lines: days to reach maximum number of
cases (90, 95 and 99%) using a non parametric method. Sat = % saturation
(percentage of maximum cases currently)
STATISTICAL TABLES:
   Date.NextDays nuevos totales nuevos.100hab p.Hosp.100hab p.UCI.100hab p.death.100hab p.Recup.100hab
65    2020-04-24    977   47548            13             4            1              1              6
66    2020-04-25    917   48465            12             4            1              1              6
67    2020-04-26    841   49306            11             4            0              1              5
68    2020-04-27    783   50089            10             3            0              1              5
69    2020-04-28    766   50855            10             3            0              1              5
70    2020-04-29    764   51619            10             3            0              1              5
71    2020-04-30    757   52376            10             3            0              1              5
VARIABLES:
DESCRIPCION DE LAS VARIABLES:
nuevos = casos nuevos de ese dia
totales (Total cases predicted)
nuevos.100hab: casos nuevos por 100000 hab
p.Hosp.100hab: pacientes hospitalizados por 100000 hab
UCI.100hab : pacientes UCI por 100000 hab
deathth.100hab: pacientes fallecidos por 100000 hab
Recup.100hab: pacientes recuperados por 100000 hab
⇢DAY: 2020/4/22 extraordinary(+) measures in Spain
Algorithm variation(*slow regression-2)
Efron.r.squared>0.9 (parametric model coefficient of determination)
data from https://covid19.isciii.es/
Cases in Spain projection:


Vertical yellow line: today, magenta lines: days to reach maximum number of cases (90, 95 and 99%) using a non parametric method. Sat = % saturation (percentage of maximum cases currently)
STATISTICAL TABLES:
   Date.NextDays nuevos totales nuevos.100hab p.Hosp.100hab p.UCI.100hab p.death.100hab p.Recup.100hab
64    2020-04-23   3521  216543             7             1            0              1              5
65    2020-04-24   3315  219858             7             1            0              1              5
66    2020-04-25   3123  222981             7             1            0              1              5
67    2020-04-26   2980  225961             6             1            0              1              4
68    2020-04-27   2899  228860             6             1            0              1              4
69    2020-04-28   2835  231695             6             1            0              1              4
70    2020-04-29   2771  234466             6             1            0              1              4
VARIABLES:
DESCRIPCION DE LAS VARIABLES:
nuevos = casos nuevos de ese dia
totales (Total cases predicted)
nuevos.100hab: casos nuevos por 100000 hab
p.Hosp.100hab: pacientes hospitalizados por 100000 hab
UCI.100hab : pacientes UCI por 100000 hab
deathth.100hab: pacientes fallecidos por 100000 hab
Recup.100hab: pacientes recuperados por 100000 hab
Cases in Catalonia projection:


Vertical
yellow line: today, magenta lines: days to reach maximum number of
cases (90, 95 and 99%) using a non parametric method. Sat = % saturation
(percentage of maximum cases currently)
STATISTICAL TABLES:
   Date.NextDays nuevos totales nuevos.100hab p.Hosp.100hab p.UCI.100hab p.death.100hab p.Recup.100hab
64    2020-04-23    810   45702            11             4            0              1              6
65    2020-04-24    772   46474            10             4            0              1              5
66    2020-04-25    750   47224            10             4            0              1              5
67    2020-04-26    726   47950            10             3            0              1              5
68    2020-04-27    705   48655             9             3            0              1              5
69    2020-04-28    692   49347             9             3            0              1              5
70    2020-04-29    679   50026             9             3            0              1              5
VARIABLES:
DESCRIPCION DE LAS VARIABLES:
nuevos = casos nuevos de ese dia
totales (Total cases predicted)
nuevos.100hab: casos nuevos por 100000 hab
p.Hosp.100hab: pacientes hospitalizados por 100000 hab
UCI.100hab : pacientes UCI por 100000 hab
deathth.100hab: pacientes fallecidos por 100000 hab
Recup.100hab: pacientes recuperados por 100000 hab
⇢DAY: 2020/4/21 extraordinary(+) measures in Spain
Algorithm variation(*slow regression-2)
Efron.r.squared>0.9 (parametric model coefficient of determination)
data from https://covid19.isciii.es/
Cases in Spain projection:


Vertical yellow line: today, magenta lines: days to reach maximum number of cases (90, 95 and 99%) using a non parametric method. Sat = % saturation (percentage of maximum cases currently)
STATISTICAL TABLES:
   Date.NextDays nuevos totales nuevos.100hab p.Hosp.100hab p.UCI.100hab p.death.100hab p.Recup.100hab
63    2020-04-22   3425  211812             7             1            0              1              5
64    2020-04-23   3243  215055             7             1            0              1              5
65    2020-04-24   3086  218141             7             1            0              1              5
66    2020-04-25   2964  221105             6             1            0              1              4
67    2020-04-26   2875  223980             6             1            0              1              4
68    2020-04-27   2802  226782             6             1            0              1              4
69    2020-04-28   2730  229512             6             1            0              1              4
VARIABLES:
DESCRIPCION DE LAS VARIABLES:
nuevos = casos nuevos de ese dia
totales (Total cases predicted)
nuevos.100hab: casos nuevos por 100000 hab
p.Hosp.100hab: pacientes hospitalizados por 100000 hab
UCI.100hab : pacientes UCI por 100000 hab
deathth.100hab: pacientes fallecidos por 100000 hab
Recup.100hab: pacientes recuperados por 100000 hab
Cases in Catalonia projection:


Vertical
yellow line: today, magenta lines: days to reach maximum number of
cases (90, 95 and 99%) using a non parametric method. Sat = % saturation
(percentage of maximum cases currently)
STATISTICAL TABLES:
   Date.NextDays nuevos totales nuevos.100hab p.Hosp.100hab p.UCI.100hab p.death.100hab p.Recup.100hab
63    2020-04-22    813   44615            11             5            0              1              6
64    2020-04-23    747   45362            10             4            0              1              6
65    2020-04-24    717   46079            10             4            0              1              5
66    2020-04-25    712   46791             9             4            0              1              5
67    2020-04-26    702   47493             9             3            0              1              5
68    2020-04-27    685   48178             9             3            0              1              5
69    2020-04-28    667   48845             9             3            0              1              5
VARIABLES:
DESCRIPCION DE LAS VARIABLES:
nuevos = casos nuevos de ese dia
totales (Total cases predicted)
nuevos.100hab: casos nuevos por 100000 hab
p.Hosp.100hab: pacientes hospitalizados por 100000 hab
UCI.100hab : pacientes UCI por 100000 hab
deathth.100hab: pacientes fallecidos por 100000 hab
Recup.100hab: pacientes recuperados por 100000 hab
⇢DAY: 2020/4/20 extraordinary(+) measures in Spain
Algorithm variation(*slow regression-2)
Efron.r.squared>0.9 (parametric model coefficient of determination)
data from https://covid19.isciii.es/
TODAY THE PREDICTION IS WRONG, SOME CATALONIA VARIABLES [DEATHS, AND OTHERS] WERE REMOVED !
Cases in Spain projection:


Vertical yellow line: today, magenta lines: days to reach maximum number of cases (90, 95 and 99%) using a non parametric method. Sat = % saturation (percentage of maximum cases currently)
STATISTICAL TABLES:
Date.NextDays nuevos totales nuevos.100hab p.Hosp.100hab p.UCI.100hab p.death.100hab p.Recup.100hab
62    2020-04-21   3436  207612             7            NA           NA             NA             NA
63    2020-04-22   3261  210873             7            NA           NA             NA             NA
64    2020-04-23   3107  213980             7            NA           NA             NA             NA
65    2020-04-24   2995  216975             6            NA           NA             NA             NA
66    2020-04-25   2908  219883             6            NA           NA             NA             NA
67    2020-04-26   2829  222712             6            NA           NA             NA             NA
68    2020-04-27   2750  225462             6            NA           NA             NA             NA
VARIABLES:
DESCRIPCION DE LAS VARIABLES:
nuevos = casos nuevos de ese dia
totales (Total cases predicted)
nuevos.100hab: casos nuevos por 100000 hab
p.Hosp.100hab: pacientes hospitalizados por 100000 hab
UCI.100hab : pacientes UCI por 100000 hab
deathth.100hab: pacientes fallecidos por 100000 hab
Recup.100hab: pacientes recuperados por 100000 hab
Cases in Catalonia projection:


Vertical
yellow line: today, magenta lines: days to reach maximum number of
cases (90, 95 and 99%) using a non parametric method. Sat = % saturation
(percentage of maximum cases currently)
STATISTICAL TABLES:
Date.NextDays nuevos totales nuevos.100hab p.Hosp.100hab p.UCI.100hab p.death.100hab p.Recup.100hab
62    2020-04-21    906   44018            12            NA           NA             NA             NA
63    2020-04-22    855   44873            11            NA           NA             NA             NA
64    2020-04-23    789   45662            11            NA           NA             NA             NA
65    2020-04-24    737   46399            10            NA           NA             NA             NA
66    2020-04-25    716   47115            10            NA           NA             NA             NA
67    2020-04-26    707   47822             9            NA           NA             NA             NA
68    2020-04-27    695   48517             9            NA           NA             NA             NA
VARIABLES:
DESCRIPCION DE LAS VARIABLES:
nuevos = casos nuevos de ese dia
totales (Total cases predicted)
nuevos.100hab: casos nuevos por 100000 hab
p.Hosp.100hab: pacientes hospitalizados por 100000 hab
UCI.100hab : pacientes UCI por 100000 hab
deathth.100hab: pacientes fallecidos por 100000 hab
Recup.100hab: pacientes recuperados por 100000 hab
⇢DAY: 2020/4/19 extraordinary(+) measures in Spain
Algorithm variation(*slow regression-2)
Efron.r.squared>0.9 (parametric model coefficient of determination)
data from https://covid19.isciii.es/
TODAY THE PREDICTION IS WRONG, SOME CATALONIA VARIABLES [DEATHS, AND OTHERS] WERE REMOVED !
Cases in Spain projection:


Vertical yellow line: today, magenta lines: days to reach maximum number of cases (90, 95 and 99%) using a non parametric method. Sat = % saturation (percentage of maximum cases currently)
STATISTICAL TABLES:
 Date.NextDays nuevos totales nuevos.100hab p.Hosp.100hab p.UCI.100hab p.death.100hab p.Recup.100hab
61    2020-04-20   3512  203720             7            NA           NA             NA             NA
62    2020-04-21   3324  207044             7            NA           NA             NA             NA
63    2020-04-22   3162  210206             7            NA           NA             NA             NA
64    2020-04-23   3036  213242             6            NA           NA             NA             NA
65    2020-04-24   2942  216184             6            NA           NA             NA             NA
66    2020-04-25   2859  219043             6            NA           NA             NA             NA
67    2020-04-26   2778  221821             6            NA           NA             NA             NA
VARIABLES:
DESCRIPCION DE LAS VARIABLES:
nuevos = casos nuevos de ese dia
totales (Total cases predicted)
nuevos.100hab: casos nuevos por 100000 hab
p.Hosp.100hab: pacientes hospitalizados por 100000 hab
UCI.100hab : pacientes UCI por 100000 hab
deathth.100hab: pacientes fallecidos por 100000 hab
Recup.100hab: pacientes recuperados por 100000 hab
Cases in Catalonia projection:


Vertical
yellow line: today, magenta lines: days to reach maximum number of
cases (90, 95 and 99%) using a non parametric method. Sat = % saturation
(percentage of maximum cases currently)
STATISTICAL TABLES:
Date.NextDays nuevos totales nuevos.100hab p.Hosp.100hab p.UCI.100hab p.death.100hab p.Recup.100hab
61    2020-04-20    799   42475            11            NA           NA             NA             NA
62    2020-04-21    752   43227            10            NA           NA             NA             NA
63    2020-04-22    729   43956            10            NA           NA             NA             NA
64    2020-04-23    705   44661             9            NA           NA             NA             NA
65    2020-04-24    680   45341             9            NA           NA             NA             NA
66    2020-04-25    664   46005             9            NA           NA             NA             NA
67    2020-04-26    647   46652             9            NA           NA             NA             NA
VARIABLES:
DESCRIPCION DE LAS VARIABLES:
nuevos = casos nuevos de ese dia
totales (Total cases predicted)
nuevos.100hab: casos nuevos por 100000 hab
p.Hosp.100hab: pacientes hospitalizados por 100000 hab
UCI.100hab : pacientes UCI por 100000 hab
deathth.100hab: pacientes fallecidos por 100000 hab
Recup.100hab: pacientes recuperados por 100000 hab
⇢DAY: 2020/4/18 extraordinary(+) measures in Spain
Algorithm variation(*slow regression-2)
Efron.r.squared>0.9 (parametric model coefficient of determination)
data from https://covid19.isciii.es/
TODAY THE PREDICTION IS WRONG, SOME CATALONIA VARIABLES [DEATHS, AND OTHERS] WERE REMOVED !
Cases in Spain projection:


Vertical yellow line: today, magenta lines: days to reach maximum number of cases (90, 95 and 99%) using a non parametric method. Sat = % saturation (percentage of maximum cases currently)
STATISTICAL TABLES:
   Date.NextDays nuevos totales nuevos.100hab p.Hosp.100hab p.UCI.100hab p.death.100hab p.Recup.100hab
60    2020-04-19   3559  199501             8            NA           NA             NA             NA
61    2020-04-20   3336  202837             7            NA           NA             NA             NA
62    2020-04-21   3172  206009             7            NA           NA             NA             NA
63    2020-04-22   3052  209061             6            NA           NA             NA             NA
64    2020-04-23   2955  212016             6            NA           NA             NA             NA
65    2020-04-24   2866  214882             6            NA           NA             NA             NA
66    2020-04-25   2780  217662             6            NA           NA             NA             NA
VARIABLES:
DESCRIPCION DE LAS VARIABLES:
nuevos = casos nuevos de ese dia
totales (Total cases predicted)
nuevos.100hab: casos nuevos por 100000 hab
p.Hosp.100hab: pacientes hospitalizados por 100000 hab
UCI.100hab : pacientes UCI por 100000 hab
deathth.100hab: pacientes fallecidos por 100000 hab
Recup.100hab: pacientes recuperados por 100000 hab
Cases in Catalonia projection:


Vertical
yellow line: today, magenta lines: days to reach maximum number of
cases (90, 95 and 99%) using a non parametric method. Sat = % saturation
(percentage of maximum cases currently)
STATISTICAL TABLES:
   Date.NextDays nuevos totales nuevos.100hab p.Hosp.100hab p.UCI.100hab p.death.100hab p.Recup.100hab
60    2020-04-19    834   41434            11            NA           NA             NA             NA
61    2020-04-20    761   42195            10            NA           NA             NA             NA
62    2020-04-21    724   42919            10            NA           NA             NA             NA
63    2020-04-22    718   43637            10            NA           NA             NA             NA
64    2020-04-23    709   44346             9            NA           NA             NA             NA
65    2020-04-24    690   45036             9            NA           NA             NA             NA
66    2020-04-25    670   45706             9            NA           NA             NA             NA
VARIABLES:
DESCRIPCION DE LAS VARIABLES:
nuevos = casos nuevos de ese dia
totales (Total cases predicted)
nuevos.100hab: casos nuevos por 100000 hab
p.Hosp.100hab: pacientes hospitalizados por 100000 hab
UCI.100hab : pacientes UCI por 100000 hab
deathth.100hab: pacientes fallecidos por 100000 hab
Recup.100hab: pacientes recuperados por 100000 hab
⇢DAY: 2020/4/17 extraordinary(+) measures in Spain
Algorithm variation(*slow regression-2)
Efron.r.squared>0.9 (parametric model coefficient of determination)
data from https://covid19.isciii.es/
TODAY THE PREDICTION IS WRONG, SOME CATALONIA VARIABLES [DEATHS, AND OTHERS] WERE REMOVED !
Cases in Spain projection:


Vertical yellow line: today, magenta lines: days to reach maximum number of cases (90, 95 and 99%) using a non parametric method. Sat = % saturation (percentage of maximum cases currently)
STATISTICAL TABLES:
Date.NextDays nuevos totales nuevos.100hab p.Hosp.100hab p.UCI.100hab p.death.100hab p.Recup.100hab
59    2020-04-18   3624  195348             8            NA           NA             NA             NA
60    2020-04-19   3394  198742             7            NA           NA             NA             NA
61    2020-04-20   3214  201956             7            NA           NA             NA             NA
62    2020-04-21   3077  205033             7            NA           NA             NA             NA
63    2020-04-22   2968  208001             6            NA           NA             NA             NA
64    2020-04-23   2877  210878             6            NA           NA             NA             NA
65    2020-04-24   2788  213666             6            NA           NA             NA             NA
VARIABLES:
DESCRIPCION DE LAS VARIABLES:
nuevos = casos nuevos de ese dia
totales (Total cases predicted)
nuevos.100hab: casos nuevos por 100000 hab
p.Hosp.100hab: pacientes hospitalizados por 100000 hab
UCI.100hab : pacientes UCI por 100000 hab
deathth.100hab: pacientes fallecidos por 100000 hab
Recup.100hab: pacientes recuperados por 100000 hab
Cases in Catalonia projection:

Vertical yellow line: today, magenta lines: days to reach maximum number of cases (90, 95 and 99%) using a non parametric method. Sat = % saturation (percentage of maximum cases currently)
STATISTICAL TABLES:
Date.NextDays nuevos totales nuevos.100hab p.Hosp.100hab p.UCI.100hab p.death.100hab p.Recup.100hab
59    2020-04-18    954   40897            13            NA           NA             NA             NA
60    2020-04-19    891   41788            12            NA           NA             NA             NA
61    2020-04-20    815   42603            11            NA           NA             NA             NA
62    2020-04-21    753   43356            10            NA           NA             NA             NA
63    2020-04-22    728   44084            10            NA           NA             NA             NA
64    2020-04-23    717   44801            10            NA           NA             NA             NA
65    2020-04-24    706   45507             9            NA           NA             NA             NA
VARIABLES:
DESCRIPCION DE LAS VARIABLES:
nuevos = casos nuevos de ese dia
totales (Total cases predicted)
nuevos.100hab: casos nuevos por 100000 hab
p.Hosp.100hab: pacientes hospitalizados por 100000 hab
UCI.100hab : pacientes UCI por 100000 hab
deathth.100hab: pacientes fallecidos por 100000 hab
Recup.100hab: pacientes recuperados por 100000 hab
⇢DAY: 2020/4/16 extraordinary(+) measures in Spain
Algorithm variation(*slow regression-2)
Efron.r.squared>0.9 (parametric model coefficient of determination)
data from https://covid19.isciii.es/
TODAY THE STATISTIC IS WRONG, SOME CATALONIA VARIABLES [DEATHS, AND OTHERS] WERE REMOVED !
Cases in Spain projection:


Vertical yellow line: today, magenta lines: days to reach maximum number of cases (90, 95 and 99%) using a non parametric method. Sat = % saturation (percentage of maximum cases currently)
STATISTICAL TABLES:
| uci | hospitalizados | fallecidos | nuevos | confirmados |
| 7935 | 78069 | 20044 | 3968 | 192034 |
| 7943 | 78777 | 20465 | 3640 | 195674 |
| 7948 | 79445 | 20867 | 3341 | 199015 |
| 7952 | 80070 | 21254 | 3166 | 202181 |
| 7954 | 80651 | 21628 | 3052 | 205233 |
| 7956 | 81196 | 21989 | 2968 | 208201 |
| 2877 | 211078 |
VARIABLES:
DESCRIPCION DE LAS VARIABLES:
nuevos = casos nuevos de ese dia
totales (Total cases predicted)
nuevos.100hab: casos nuevos por 100000 hab
p.Hosp.100hab: pacientes hospitalizados por 100000 hab
UCI.100hab : pacientes UCI por 100000 hab
deathth.100hab: pacientes fallecidos por 100000 hab
Recup.100hab: pacientes recuperados por 100000 hab
Cases in Catalonia projection:

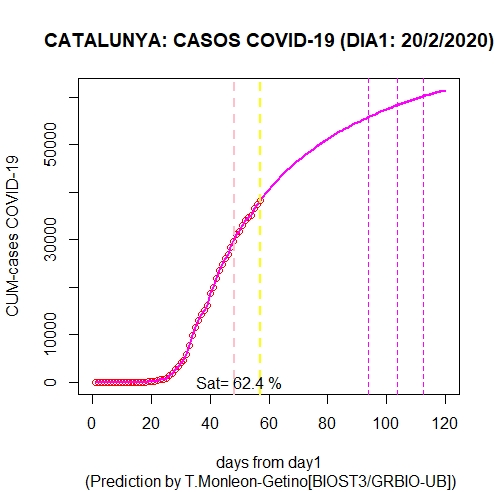
Vertical
yellow line: today, magenta lines: days to reach
maximum number of cases (90, 95 and 99%) using a non parametric method.
Sat = % saturation (percentage of maximum cases currently)
STATISTICAL TABLES:
 Date.NextDays nuevos totales nuevos.100hab p.Hosp.100hab p.UCI.100hab p.death.100hab p.Recup.100hab
57    2020-04-17    814   39130            11             5            0              1              7
58    2020-04-18    761   39891            10             5            0              1              7
59    2020-04-19    723   40614            10             4            1              1              7
60    2020-04-20    698   41312             9             4            1              1              6
61    2020-04-21    673   41985             9             4            0              1              6
62    2020-04-22    653   42638             9             4            0              1              6
63    2020-04-23    633   43271             8             NA           NA             NA             NA
VARIABLES:
DESCRIPCION DE LAS VARIABLES:
nuevos = casos nuevos de ese dia
totales (Total cases predicted)
nuevos.100hab: casos nuevos por 100000 hab
p.Hosp.100hab: pacientes hospitalizados por 100000 hab
UCI.100hab : pacientes UCI por 100000 hab
deathth.100hab: pacientes fallecidos por 100000 hab
Recup.100hab: pacientes recuperados por 100000 hab
⇢DAY: 2020/4/15 extraordinary(+) measures in Spain
Algorithm variation(*slow regression-2)
Efron.r.squared>0.9 (parametric model coefficient of determination)
data from https://covid19.isciii.es/
Cases in Spain projection:


Vertical yellow line: today, magenta lines: days to reach maximum number of cases (90, 95 and 99%) using a non parametric method. Sat = % saturation (percentage of maximum cases currently)
STATISTICAL TABLES:Date.NextDays nuevos totales nuevos.100hab
57 2020-04-17 3968 192034 8
58 2020-04-18 3640 195674 8
59 2020-04-19 3341 199015 7
60 2020-04-20 3166 202181 7
61 2020-04-21 3052 205233 7
62 2020-04-22 2968 208201 6
VARIABLES:
DESCRIPCION DE LAS VARIABLES:
nuevos = casos nuevos de ese dia
totales (Total cases predicted)
nuevos.100hab: casos nuevos por 100000 hab
p.Hosp.100hab: pacientes hospitalizados por 100000 hab
UCI.100hab : pacientes UCI por 100000 hab
deathth.100hab: pacientes fallecidos por 100000 hab
Recup.100hab: pacientes recuperados por 100000 hab
Cases in Catalonia projection:


Vertical
yellow line: today, magenta lines: days to reach
maximum number of cases (90, 95 and 99%) using a non parametric method.
Sat = % saturation (percentage of maximum cases currently)
STATISTICAL TABLES:
   Date.NextDays nuevos totales nuevos.100hab p.Hosp.100hab p.UCI.100hab p.death.100hab p.Recup.100hab
57    2020-04-16    837   38191            11             5            0              1              7
58    2020-04-17    786   38977            10             5            0              1              7
59    2020-04-18    729   39706            10             4            1              1              7
60    2020-04-19    696   40402             9             4            1              1              6
61    2020-04-20    678   41080             9             4            0              1              6
62    2020-04-21    656   41736             9             4            0              1              6
63    2020-04-22    634   42370             8             4            0              1              6
VARIABLES:
DESCRIPCION DE LAS VARIABLES:
nuevos = casos nuevos de ese dia
totales (Total cases predicted)
nuevos.100hab: casos nuevos por 100000 hab
p.Hosp.100hab: pacientes hospitalizados por 100000 hab
UCI.100hab : pacientes UCI por 100000 hab
deathth.100hab: pacientes fallecidos por 100000 hab
Recup.100hab: pacientes recuperados por 100000 hab
⇢DAY: 2020/4/14 extraordinary(+) measures in Spain
Algorithm variation(*slow regression-2)
Efron.r.squared>0.9 (parametric model coefficient of determination)
data from https://covid19.isciii.es/
Cases in Spain projection:


Vertical yellow line: today, magenta lines: days to reach maximum number of cases (90, 95 and 99%) using a non parametric method. Sat = % saturation (percentage of maximum cases currently)
STATISTICAL TABLES:
   Date.NextDays nuevos totales nuevos.100hab p.Hosp.100hab p.UCI.100hab p.death.100hab p.Recup.100hab
56    2020-04-15   3803  181434             8             1            0              1              6
57    2020-04-16   3681  185115             8             1            0              1              5
58    2020-04-17   3481  188596             7             2            0              1              5
59    2020-04-18   3275  191871             7             2            0              1              5
60    2020-04-19   3131  195002             7             1            0              1              5
61    2020-04-20   3018  198020             6             1            0              1              4
62    2020-04-21   2918  200938             6             1            0              1              4
VARIABLES:
DESCRIPCION DE LAS VARIABLES:
nuevos = casos nuevos de ese dia
totales (Total cases predicted)
nuevos.100hab: casos nuevos por 100000 hab
p.Hosp.100hab: pacientes hospitalizados por 100000 hab
UCI.100hab : pacientes UCI por 100000 hab
deathth.100hab: pacientes fallecidos por 100000 hab
Recup.100hab: pacientes recuperados por 100000 hab
Cases in Catalonia projection:


STATISTICAL TABLES:
   Date.NextDays nuevos totales nuevos.100hab p.Hosp.100hab p.UCI.100hab p.death.100hab p.Recup.100hab
56    2020-04-15    852   37357            11             5            1              1              7
57    2020-04-16    838   38195            11             5            1              1              7
58    2020-04-17    790   38985            11             5            1              1              7
59    2020-04-18    733   39718            10             5            1              1              6
60    2020-04-19    698   40416             9             4            1              1              6
61    2020-04-20    674   41090             9             4            1              1              6
62    2020-04-21    655   41745             9             4            0              1              6
VARIABLES:
DESCRIPCION DE LAS VARIABLES:
nuevos = casos nuevos de ese dia
totales (Total cases predicted)
nuevos.100hab: casos nuevos por 100000 hab
p.Hosp.100hab: pacientes hospitalizados por 100000 hab
UCI.100hab : pacientes UCI por 100000 hab
deathth.100hab: pacientes fallecidos por 100000 hab
Recup.100hab: pacientes recuperados por 100000 hab
⇢DAY: 2020/4/13 extraordinary(+) measures in Spain
Algorithm variation(*slow regression-2)
Efron.r.squared>0.9 (parametric model coefficient of determination)
data from https://covid19.isciii.es/
Cases in Spain projection:


Vertical yellow line: today, magenta lines: days to reach maximum number of cases (90, 95 and 99%) using a non parametric method. Sat = % saturation (percentage of maximum cases currently)
STATISTICAL TABLES:
     Date.NextDays nuevos totales nuevos.100hab p.Hosp.100hab p.UCI.100hab p.death.100hab p.Recup.100hab
55    2020-04-14   2719  175258             6             1            0              1              5
56    2020-04-15   2387  177645             5             0            0              1              5
57    2020-04-16   2109  179754             4             0            0              1              4
58    2020-04-17   1855  181609             4             0            0              1              4
59    2020-04-18   1618  183227             3             0            0              1              4
60    2020-04-19   1401  184628             3             0            0              0              3
61    2020-04-20   1208  185836             3             0            0              0              3
VARIABLES:
DESCRIPCION DE LAS VARIABLES:
nuevos = casos nuevos de ese dia
totales (Total cases predicted)
nuevos.100hab: casos nuevos por 100000 hab
p.Hosp.100hab: pacientes hospitalizados por 100000 hab
UCI.100hab : pacientes UCI por 100000 hab
deathth.100hab: pacientes fallecidos por 100000 hab
Recup.100hab: pacientes recuperados por 100000 hab
Cases in Catalonia projection:


STATISTICAL TABLES:
   Date.NextDays nuevos totales nuevos.100hab p.Hosp.100hab p.UCI.100hab p.death.100hab p.Recup.100hab
55    2020-04-14    557   35754             7             3            0              1              6
56    2020-04-15    490   36244             7             2            0              1              5
57    2020-04-16    452   36696             6             1            0              0              4
58    2020-04-17    417   37113             6             1            0              0              4
59    2020-04-18    372   37485             5             1            0              0              3
60    2020-04-19    323   37808             4             0            0              0              3
61    2020-04-20    279   38087             4             0            0              0              2
VARIABLES:
DESCRIPCION DE LAS VARIABLES:
nuevos = casos nuevos de ese dia
totales (Total cases predicted)
nuevos.100hab: casos nuevos por 100000 hab
p.Hosp.100hab: pacientes hospitalizados por 100000 hab
UCI.100hab : pacientes UCI por 100000 hab
deathth.100hab: pacientes fallecidos por 100000 hab
Recup.100hab: pacientes recuperados por 100000 hab
⇢DAY: 2020/4/12 extraordinary(+) measures in Spain
Algorithm variation(*slow regression-2)
Efron.r.squared>0.9 (parametric model coefficient of determination)
data from https://covid19.isciii.es/
Cases in Spain projection:


Vertical yellow line: today, magenta lines: days to reach maximum number of cases (90, 95 and 99%) using a non parametric method. Sat = % saturation (percentage of maximum cases currently)
STATISTICAL TABLES:
   Date.NextDays nuevos totales nuevos.100hab p.Hosp.100hab p.UCI.100hab p.death.100hab p.Recup.100hab
54    2020-04-13   3908  173402             8             3            0              1              6
55    2020-04-14   3796  177198             8             2            0              1              6
56    2020-04-15   3701  180899             8             2            0              1              5
57    2020-04-16   3593  184492             8             2            0              1              5
58    2020-04-17   3453  187945             7             2            0              1              5
59    2020-04-18   3312  191257             7             2            0              1              5
60    2020-04-19   3180  194437             7             2            0              1              5
VARIABLES:
DESCRIPCION DE LAS VARIABLES:
nuevos = casos nuevos de ese dia
totales (Total cases predicted)
nuevos.100hab: casos nuevos por 100000 hab
p.Hosp.100hab: pacientes hospitalizados por 100000 hab
UCI.100hab : pacientes UCI por 100000 hab
deathth.100hab: pacientes fallecidos por 100000 hab
Recup.100hab: pacientes recuperados por 100000 hab
Cases in Catalonia projection:


Vertical yellow line: today, magenta lines: days to reach maximum number of cases (90, 95 and 99%) using a non parametric method. Sat = % saturation (percentage of maximum cases currently)
STATISTICAL TABLES:
Date.NextDays nuevos totales nuevos.100hab p.Hosp.100hab p.UCI.100hab p.death.100hab p.Recup.100hab
54    2020-04-13    872   35598            12             6            1              1              8
55    2020-04-14    836   36434            11             6            1              1              8
56    2020-04-15    819   37253            11             6            1              1              8
57    2020-04-16    803   38056            11             6            1              1              7
58    2020-04-17    776   38832            10             5            1              1              7
59    2020-04-18    745   39577            10             5            1              1              7
60    2020-04-19    716   40293            10             5            1              1              7
VARIABLES:
DESCRIPCION DE LAS VARIABLES:
nuevos = casos nuevos de ese dia
totales (Total cases predicted)
nuevos.100hab: casos nuevos por 100000 hab
p.Hosp.100hab: pacientes hospitalizados por 100000 hab
UCI.100hab : pacientes UCI por 100000 hab
deathth.100hab: pacientes fallecidos por 100000 hab
Recup.100hab: pacientes recuperados por 100000 hab
⇢DAY: 2020/4/11 extraordinary(+) measures in Spain
Algorithm variation(*slow regression-2)
Efron.r.squared>0.9 (parametric model coefficient of determination)
data from https://covid19.isciii.es/
Cases in Spain projection:


vertical yellow line: today, vetical red line: day of inflection in number of cases, vertical green lines: days to reach maximum number of cases (90, 95 and 99%) using a paametric method, magenta lines: days to reach maximum number of cases (90, 95 and 99%) using a non parametric method
STATISTICAL TABLES:
   Date.NextDays nuevos totales nuevos.100hab p.Hosp.100hab p.UCI.100hab p.death.100hab p.Recup.100hab
53    2020-04-12   4278  170295             9             4            0              1              7
54    2020-04-13   4138  174433             9             3            0              1              6
55    2020-04-14   3993  178426             8             2            0              1              6
56    2020-04-15   3854  182280             8             2            0              1              6
57    2020-04-16   3711  185991             8             2            0              1              6
58    2020-04-17   3569  189560             8             2            0              1              5
59    2020-04-18   3436  192996             7             2            0              1              5
VARIABLES:
DESCRIPCION DE LAS VARIABLES:
nuevos = casos nuevos de ese dia
totales (Total cases predicted)
nuevos.100hab: casos nuevos por 100000 hab
p.Hosp.100hab: pacientes hospitalizados por 100000 hab
UCI.100hab : pacientes UCI por 100000 hab
deathth.100hab: pacientes fallecidos por 100000 hab
Recup.100hab: pacientes recuperados por 100000 hab
Cases in Catalonia projection:


vertical yellow line: today, vetical red line: day of inflection in number of cases, vertical green lines: days to reach maximum number of cases (90, 95 and 99%) using a paametric method, magenta lines: days to reach maximum number of cases (90, 95 and 99%) using a non parametric method
STATISTICAL TABLES:
Date.NextDays nuevos totales nuevos.100hab p.Hosp.100hab p.UCI.100hab p.death.100hab p.Recup.100hab
53    2020-04-12    985   35012            13             6            1              1              9
54    2020-04-13    949   35961            13             6            1              1              9
55    2020-04-14    906   36867            12             6            1              1              8
56    2020-04-15    868   37735            12             6            1              1              8
57    2020-04-16    839   38574            11             6            1              1              8
58    2020-04-17    811   39385            11             5            1              1              7
59    2020-04-18    784   40169            10             5            1              1              7
VARIABLES:
DESCRIPCION DE LAS VARIABLES:
nuevos = casos nuevos de ese dia
totales (Total cases predicted)
nuevos.100hab: casos nuevos por 100000 hab
p.Hosp.100hab: pacientes hospitalizados por 100000 hab
UCI.100hab : pacientes UCI por 100000 hab
deathth.100hab: pacientes fallecidos por 100000 hab
Recup.100hab: pacientes recuperados por 100000 hab
⇢DAY: 2020/4/9 extraordinary(+) measures in Spain
Algorithm variation(*slow regression-2)
Efron.r.squared>0.9 (parametric model coefficient of determination)
data from https://covid19.isciii.es/
Cases in Spain projection:


vertical yellow line: today, vetical red line: day of inflection in number of cases, vertical green lines: days to reach maximum number of cases (90, 95 and 99%) using a paametric method, magenta lines: days to reach maximum number of cases (90, 95 and 99%) using a non parametric method
STATISTICAL TABLES:
   Date.NextDays nuevos totales nuevos.100hab p.Hosp.100hab p.UCI.100hab p.death.100hab p.Recup.100hab
51    2020-04-10   4163  161183             9             1            0              1              7
52    2020-04-11   3788  164971             8             1            0              1              7
53    2020-04-12   3405  168376             7             1            0              1              7
54    2020-04-13   3021  171397             6             0            0              1              6
55    2020-04-14   2656  174053             6             0            0              1              6
56    2020-04-15   2293  176346             5             0            0              1              5
57    2020-04-16   1983  178329             4             0            0              1              5
VARIABLES:
DESCRIPCION DE LAS VARIABLES:
nuevos = casos nuevos de ese dia
totales (Total cases predicted)
nuevos.100hab: casos nuevos por 100000 hab
p.Hosp.100hab: pacientes hospitalizados por 100000 hab
UCI.100hab : pacientes UCI por 100000 hab
deathth.100hab: pacientes fallecidos por 100000 hab
Recup.100hab: pacientes recuperados por 100000 hab
Cases in Catalonia projection:


vertical yellow line: today, vetical red line: day of inflection in number of cases, vertical green lines: days to reach maximum number of cases (90, 95 and 99%) using a paametric method, magenta lines: days to reach maximum number of cases (90, 95 and 99%) using a non parametric method
STATISTICAL TABLES:
   Date.NextDays nuevos totales nuevos.100hab p.Hosp.100hab p.UCI.100hab p.death.100hab p.Recup.100hab
51    2020-04-10    911   32735            12             6            1              1              9
52    2020-04-11    829   33564            11             5            0              1              8
53    2020-04-12    746   34310            10             4            0              1              7
54    2020-04-13    660   34970             9             3            0              1              7
55    2020-04-14    582   35552             8             2            0              0              6
56    2020-04-15    503   36055             7             1            0              0              5
57    2020-04-16    439   36494             6             1            0              0              4
VARIABLES:
DESCRIPCION DE LAS VARIABLES:
nuevos = casos nuevos de ese dia
totales (Total cases predicted)
nuevos.100hab: casos nuevos por 100000 hab
p.Hosp.100hab: pacientes hospitalizados por 100000 hab
UCI.100hab : pacientes UCI por 100000 hab
deathth.100hab: pacientes fallecidos por 100000 hab
Recup.100hab: pacientes recuperados por 100000 hab
⇢DAY: 2020/4/8 extraordinary(+) measures in Spain
Algorithm variation(*slow regression-2)
Efron.r.squared>0.9 (parametric model coefficient of determination)
data from https://covid19.isciii.es/
Cases in Spain projection:


vertical yellow line: today, vetical red line: day of inflection in number of cases, vertical green lines: days to reach maximum number of cases (90, 95 and 99%) using a paametric method, magenta lines: days to reach maximum number of cases (90, 95 and 99%) using a non parametric method
STATISTICAL TABLES:
   Date.NextDays nuevos totales nuevos.100hab p.Hosp.100hab p.UCI.100hab p.death.100hab p.Recup.100hab
50    2020-04-09   4791  157235            10             1            0              1              8
51    2020-04-10   4169  161404             9             1            0              1              8
52    2020-04-11   3616  165020             8             1            0              1              7
53    2020-04-12   3164  168184             7             0            0              1              7
54    2020-04-13   2797  170981             6             0            0              1              6
55    2020-04-14   2476  173457             5             0            0              1              6
56    2020-04-15   2179  175636             5             0            0              1              5
VARIABLES:
DESCRIPCION DE LAS VARIABLES:
nuevos = casos nuevos de ese dia
totales (Total cases predicted)
nuevos.100hab: casos nuevos por 100000 hab
p.Hosp.100hab: pacientes hospitalizados por 100000 hab
UCI.100hab : pacientes UCI por 100000 hab
deathth.100hab: pacientes fallecidos por 100000 hab
Recup.100hab: pacientes recuperados por 100000 hab
Cases in Catalonia projection:


vertical yellow line: today, vetical red line: day of inflection in number of cases, vertical green lines: days to reach maximum number of cases (90, 95 and 99%) using a paametric method, magenta lines: days to reach maximum number of cases (90, 95 and 99%) using a non parametric method
STATISTICAL TABLES:
   Date.NextDays nuevos totales nuevos.100hab p.Hosp.100hab p.UCI.100hab p.death.100hab p.Recup.100hab
50    2020-04-09   1103   32146            15             8            1              1             12
51    2020-04-10    961   33107            13             6            0              1             11
52    2020-04-11    845   33952            11             4            0              1             10
53    2020-04-12    750   34702            10             3            0              1              9
54    2020-04-13    672   35374             9             2            0              0              9
55    2020-04-14    604   35978             8             1            0              0              8
56    2020-04-15    541   36519             7             1            0              0              7
VARIABLES:
DESCRIPCION DE LAS VARIABLES:
nuevos = casos nuevos de ese dia
totales (Total cases predicted)
nuevos.100hab: casos nuevos por 100000 hab
p.Hosp.100hab: pacientes hospitalizados por 100000 hab
UCI.100hab : pacientes UCI por 100000 hab
deathth.100hab: pacientes fallecidos por 100000 hab
Recup.100hab: pacientes recuperados por 100000 hab
⇢DAY: 2020/4/7 extraordinary(+) measures in Spain
Algorithm variation(*slow regression)
Efron.r.squared>0.9 (parametric model coefficient of determination)
data from https://covid19.isciii.es/
Cases in Spain projection:


vertical yellow line: today, vetical red line: day of inflection in number of cases, vertical green lines: days to reach maximum number of cases (90, 95 and 99%) using a paametric method, magenta lines: days to reach maximum number of cases (90, 95 and 99%) using a non parametric method
STATITICAL TABLES:
   Date.NextDays nuevos totales nuevos.100hab p.Hosp.100hab p.UCI.100hab p.death.100hab p.Recup.100hab
49    2020-04-08   4451  151139             9             2            0              1              8
50    2020-04-09   4000  155139             8             1            0              1              8
51    2020-04-10   3504  158643             7             1            0              1              8
52    2020-04-11   3006  161649             6             1            0              1              8
53    2020-04-12   2526  164175             5             0            0              1              8
54    2020-04-13   2143  166318             5             0            0              1              7
55    2020-04-14   1820  168138             4             0            0              1              7
VARIABLES:
DESCRIPCION DE LAS VARIABLES:
nuevos = casos nuevos de ese dia
totales (Total cases predicted)
nuevos.100hab: casos nuevos por 100000 hab
p.Hosp.100hab: pacientes hospitalizados por 100000 hab
UCI.100hab : pacientes UCI por 100000 hab
deathth.100hab: pacientes fallecidos por 100000 hab
Recup.100hab: pacientes recuperados por 100000 hab
Cases in Catalonia projection:


STATITICAL TABLES:
   Date.NextDays nuevos totales nuevos.100hab p.Hosp.100hab p.UCI.100hab p.death.100hab p.Recup.100hab
49    2020-04-07   1165   30812            16             5            1              1             15
50    2020-04-08   1100   31912            15             5            1              1             15
51    2020-04-09   1018   32930            14             4            1              1             16
52    2020-04-10    932   33862            12             3            0              1             16
53    2020-04-11    849   34711            11             2            0              1             16
54    2020-04-12    780   35491            10             2            0              1             16
55    2020-04-13    715   36206            10             1            0              0             17
VARIABLES:
DESCRIPCION DE LAS VARIABLES:
nuevos = casos nuevos de ese dia
totales (Total cases predicted)
nuevos.100hab: casos nuevos por 100000 hab
p.Hosp.100hab: pacientes hospitalizados por 100000 hab
UCI.100hab : pacientes UCI por 100000 hab
deathth.100hab: pacientes fallecidos por 100000 hab
Recup.100hab: pacientes recuperados por 100000 hab
⇢DAY: 2020/4/6 extraordinary(+) measures in Spain
Efron.r.squared>0.9 (parametric model coefficient of determination)
data from https://covid19.isciii.es/
Cases in Spain projection:

vertical yellow line: today, vetical red line: day of inflection in number of cases, vertical green lines: days to reach maximum number of cases (90, 95 and 99%) using a paametric method, magenta lines: days to reach maximum number of cases (90, 95 and 99%) using a non parametric method
   Date.NextDays nuevos totales nuevos.100hab p.Hosp.100hab p.UCI.100hab p.death.100hab p.Recup.100hab
48    2020-04-07   2905  143413             6             5            0              1              6
49    2020-04-08   2441  145854             5             4            0              1              5
50    2020-04-09   2039  147893             4             4            0              1              5
51    2020-04-10   1701  149594             4             3            0              1              5
52    2020-04-11   1415  151009             3             3            0              1              4
53    2020-04-12   1185  152194             3             3            0              1              4
54    2020-04-13    998  153192             2             2            0              1              3
VARIABLES:
DESCRIPCION DE LAS VARIABLES:
nuevos = casos nuevos de ese dia
totales (Total cases predicted)
nuevos.100hab: casos nuevos por 100000 hab
p.Hosp.100hab: pacientes hospitalizados por 100000 hab
UCI.100hab : pacientes UCI por 100000 hab
deathth.100hab: pacientes fallecidos por 100000 hab
Recup.100hab: pacientes recuperados por 100000 hab
Cases in Catalonia projection:


vertical yellow line: today, vetical red line: day of inflection in number of cases, vertical green lines: days to reach maximum number of cases (90, 95 and 99%) using a paametric method, magenta lines: days to reach maximum number of cases (90, 95 and 99%) using a non parametric method
   Date.NextDays nuevos totales nuevos.100hab p.Hosp.100hab p.UCI.100hab p.death.100hab p.Recup.100hab
48    2020-04-07   1344   29667            18             7            1              2              9
49    2020-04-08   1271   30938            17             6            1              2              8
50    2020-04-09   1175   32113            16             6            1              2              8
51    2020-04-10   1066   33179            14             5            1              2              7
52    2020-04-11    948   34127            13             4            1              1              6
53    2020-04-12    838   34965            11             3            0              1              6
54    2020-04-13    736   35701            10             3            0              1              5
VARIABLES:
DESCRIPCION DE LAS VARIABLES:
nuevos = casos nuevos de ese dia
totales (Total cases predicted)
nuevos.100hab: casos nuevos por 100000 hab
p.Hosp.100hab: pacientes hospitalizados por 100000 hab
UCI.100hab : pacientes UCI por 100000 hab
deathth.100hab: pacientes fallecidos por 100000 hab
Recup.100hab: pacientes recuperados por 100000 hab
⇢DAY: 2020/4/5 extraordinary(+) measures in Spain
Efron.r.squared>0.9 (parametric model coefficient of determination)
data from https://covid19.isciii.es/
Cases in Spain projection:


vertical yellow line: today, vetical red line: day of inflection in number of cases, vertical green lines: days to reach maximum number of cases (90, 95 and 99%) using a paametric method, magenta lines: days to reach maximum number of cases (90, 95 and 99%) using a non parametric method
prediction next week:
   Date.NextDays nuevos totales nuevos.100hab p.Hosp.100hab p.UCI.100hab p.death.100hab p.Recup.100hab
47    2020-04-06   3107  138137             7             3            0              1              5
48    2020-04-07   2423  140560             5             3            0              1              5
49    2020-04-08   1863  142423             4             2            0              1              5
50    2020-04-09   1421  143844             3             2            0              1              4
51    2020-04-10   1074  144918             2             1            0              1              4
52    2020-04-11    794  145712             2             1            0              0              4
53    2020-04-12    569  146281             1             1            0              0              3
VARIABLES:
DESCRIPCION DE LAS VARIABLES:
nuevos = casos nuevos de ese dia
totales (Total cases predicted)
nuevos.100hab: casos nuevos por 100000 hab
p.Hosp.100hab: pacientes hospitalizados por 100000 hab
UCI.100hab : pacientes UCI por 100000 hab
deathth.100hab: pacientes fallecidos por 100000 hab
Recup.100hab: pacientes recuperados por 100000 hab
Cases in Catalonia projection:


vertical yellow line: today, vetical red line: day of inflection in number of cases, vertical green lines: days to reach maximum number of cases (90, 95 and 99%) using a paametric method, magenta lines: days to reach maximum number of cases (90, 95 and 99%) using a non parametric method
prediction next week:
   Date.NextDays nuevos totales nuevos.100hab p.Hosp.100hab p.UCI.100hab p.death.100hab p.Recup.100hab
47    2020-04-06    795   27619            11             8            1              2              8
48    2020-04-07    645   28264             9             7            0              1              7
49    2020-04-08    514   28778             7             6            0              1              5
50    2020-04-09    401   29179             5             5            0              1              4
51    2020-04-10    305   29484             4             4            0              1              4
52    2020-04-11    224   29708             3             3            0              1              3
53    2020-04-12    160   29868             2             2            0              0              2
VARIABLES:
DESCRIPCION DE LAS VARIABLES:
nuevos = casos nuevos de ese dia
totales (Total cases predicted)
nuevos.100hab: casos nuevos por 100000 hab
p.Hosp.100hab: pacientes hospitalizados por 100000 hab
UCI.100hab : pacientes UCI por 100000 hab
deathth.100hab: pacientes fallecidos por 100000 hab
Recup.100hab: pacientes recuperados por 100000 hab
⇢DAY: 2020/4/4 extraordinary(+) measures in Spain
Efron.r.squared>0.9 (parametric model coefficient of determination)
data from https://covid19.isciii.es/
Cases in Spain projection:


vertical yellow line: today, vetical red line: day of inflection in number of cases, vertical green lines: days to reach maximum number of cases (90, 95 and 99%) using a paametric method, magenta lines: days to reach maximum number of cases (90, 95 and 99%) using a non parametric method
prediction next week:
   Date.NextDays nuevos totales nuevos.100hab p.Hosp.100hab p.UCI.100hab p.death.100hab p.Recup.100hab
46    2020-04-05   5733  136490            12             6            1              2              9
47    2020-04-06   5243  141733            11             5            1              2              9
48    2020-04-07   4791  146524            10             5            1              1              9
49    2020-04-08   4350  150874             9             5            0              1             10
50    2020-04-09   3917  154791             8             4            0              1             10
51    2020-04-10   3491  158282             7             4            0              1             10
52    2020-04-11   3081  161363             7             3            0              1             10
VARIABLES:

nuevos = casos nuevos de ese dia ESPANA
totales (Total cases predicted) ESPANA
nuevos.100hab: casos nuevos por 100000 hab
UCI.100hab : pacientes UCI por 100000 hab
death.100hab: pacientes fallecidos por 100000 hab
Recup.100hab: pacientes recuperados por 100000 hab
Cases in Catalonia projection:
Efron.r.squared>0.9 (parametric model coefficient of determination)
data from https://covid19.isciii.es/


vertical yellow line: today, vetical red line: day of inflection in number of cases, vertical green lines: days to reach maximum number of cases (90, 95 and 99%) using a paametric method, magenta lines: days to reach maximum number of cases (90, 95 and 99%) using a non parametric method
prediction next week:
  Date.NextDays nuevos totales nuevos.100hab p.Hosp.100hab p.UCI.100hab p.death.100hab p.Recup.100hab
46    2020-04-05   1484   27516            20            15            2              2             13
47    2020-04-06   1380   28896            18            14            1              2             14
48    2020-04-07   1287   30183            17            13            1              2             14
49    2020-04-08   1180   31363            16            13            1              2             14
50    2020-04-09   1065   32428            14            11            1              2             15
51    2020-04-10    947   33375            13            10            1              2             15
52    2020-04-11    837   34212            11             9            1              2             15
VARIABLES:
DESCRIPCION DE LAS VARIABLES:
nuevos = casos nuevos de ese dia
totales (Total cases predicted)
nuevos.100hab: casos nuevos por 100000 hab
p.Hosp.100hab: pacientes hospitalizados por 100000 hab
UCI.100hab : pacientes UCI por 100000 hab
deathth.100hab: pacientes fallecidos por 100000 hab
Recup.100hab: pacientes recuperados por 100000 hab
⇢DAY: 2020/4/3 extraordinary(+) measures in Spain
Efron.r.squared>0.9 (parametric model coefficient of determination)
data from https://covid19.isciii.es/
Cases in Spain projection:


   Date.NextDays nuevos totales nuevos.100hab p.Hosp.100hab p.UCI.100hab p.death.100hab p.Recup.100hab
45    2020-04-04   6240  126143            13             6            1              2              8
46    2020-04-05   5750  131893            12             6            1              2              9
47    2020-04-06   5258  137151            11             6            1              2              9
48    2020-04-07   4794  141945            10             5            1              1             10
49    2020-04-08   4350  146295             9             5            1              1             10
50    2020-04-09   3915  150210             8             4            0              1             10
51    2020-04-10   3490  153700             7             4            0              1             10
DESCRIPCION DE LAS VARIABLES:
-nuevos = casos nuevos de ese dia
-Totales (Total cases predicted)
-nuevos.100hab: casos nuevos por 100000 hab
-p.Hosp.100hab: pacientes hospitalizados por 100000 hab
-UCI.100hab : pacientes UCI por 100000 hab
-deathth.100hab: pacientes fallecidos por 100000 hab
-Recup.100hab: pacientes recuperados por 100000 hab
Cases in Catalonia projection:
Efron.r.squared>0.9 (parametric model coefficient of determination)
data from https://covid19.isciii.es/


vertical yellow line: today, vetical red line: day of inflection in number of cases, vertical green lines: days to reach maximum number of cases (90, 95 and 99%) using a paametric method, magenta green lines: days to reach maximum number of cases (90, 95 and 99%) using a non parametric method
    Date.NextDays nuevos totales nuevos.100hab p.Hosp.100hab p.UCI.100hab p.death.100hab p.Recup.100hab
45    2020-04-04   1604   27050            21            17            2              3             12
46    2020-04-05   1508   28558            20            16            2              2             12
47    2020-04-06   1399   29957            19            14            1              2             12
48    2020-04-07   1292   31249            17            14            1              2             11
49    2020-04-08   1180   32429            16            13            1              2             11
50    2020-04-09   1061   33490            14            11            1              2             11
51    2020-04-10    946   34436            13            10            1              2             11


DESCRIPCION DE LAS VARIABLES:
-nuevos = casos nuevos de ese dia
-Totales (Total cases predicted)
-nuevos.100hab: casos nuevos por 100000 hab
-p.Hosp.100hab: pacientes hospitalizados por 100000 hab
-UCI.100hab : pacientes UCI por 100000 hab
-deathth.100hab: pacientes fallecidos por 100000 hab
-Recup.100hab: pacientes recuperados por 100000 hab
⇢DAY: 2020/4/2 extraordinary(+) measures in Spain
Efron.r.squared>0.9 (parametric model coefficient of determination)
data from https://covid19.isciii.es/
Cases in Spain projection:


vertical yellow line: today, vetical red line: day of inflection in number of cases, vertical green lines: days to reach maximum number of cases (90, 95 and 99%)
[1] "Next 7 days prediction of coronavirus cases in Spain. T. Monleon (BIOST3-UB"

   Date.NextDays p.casos p.cum.casos p.casos.100hab p.Hosp.100hab p.UCI.100hab p.death.100hab p.Recup.100hab
44    2020-04-03    6651      119862             14             7            1              2              8
45    2020-04-04    6204      126066             13             7            1              2              9
46    2020-04-05    5723      131789             12             6            1              2              9
47    2020-04-06    5248      137037             11             6            1              2             10
48    2020-04-07    4793      141830             10             6            1              1             10
49    2020-04-08    4355      146185              9             5            1              1             10
50    2020-04-09    3918      150103              8             4            0              1             10
> #  VARIABLES:
> #p.casos (New cases predicted)
> #p.cum.casos (Total cases predicted)
> #p.casos.100hab (New cases predicted by 10e5 hab)
> #p.Hosp (Casos NUEVOS hospitalizados)
> #p.cum.Hosp (Casos totales hospitalizados)
> #p.Hosp.100hab (Casos NUEVOS  hospitalizados by 10e5 hab)
> #p.UCI (Casos NUEVOS  UCI)
> #p.cum.UCI (Casos totales  UCI)
> #p.UCI.100hab  (Casos NUEVOS  UCI by 10e5 hab)
> #p.death (Casos NUEVOS  fallecidos)
> #p.cum.death (Casos totales  fallecidos)
> #p.death.100hab (Casos NUEVOS  fallecidos by 10e5 hab)
> #p.Recup (Casos NUEVOS  recuperados)
> #p.cum.Recup (Casos totales  recuperados)
> #p.Recup.100hab (Casos NUEVOS  recuperados by 10e5 hab)
Cases in Catalonia projection:


vertical yellow line: today, vetical red line: day of inflection in number of cases, vertical green lines: days to reach maximum number of cases (90, 95 and 99%)
"Next 7 days prediction of coronavirus cases in CATALONIA. T. Monleon (BIOST3-UB"

   Date.NextDays p.casos p.cum.casos p.casos.100hab p.Hosp.100hab p.UCI.100hab p.death.100hab p.Recup.100hab
44    2020-04-03    1722       25544             23            18            2              3             14
45    2020-04-04    1637       27181             22            18            2              3             14
46    2020-04-05    1533       28714             20            16            2              3             15
47    2020-04-06    1415       30129             19            15            1              2             15
48    2020-04-07    1293       31422             17            14            1              2             14
49    2020-04-08    1175       32597             16            12            1              2             14
50    2020-04-09    1058       33655             14            11            1              2             14

> #  VARIABLES:
> #p.casos (New cases predicted)
> #p.cum.casos (Total cases predicted)
> #p.casos.100hab (New cases predicted by 10e5 hab)
> #p.Hosp (Casos NUEVOS hospitalizados)
> #p.cum.Hosp (Casos totales hospitalizados)
> #p.Hosp.100hab (Casos NUEVOS  hospitalizados by 10e5 hab)
> #p.UCI (Casos NUEVOS  UCI)
> #p.cum.UCI (Casos totales  UCI)
> #p.UCI.100hab  (Casos NUEVOS  UCI by 10e5 hab)
> #p.death (Casos NUEVOS  fallecidos)
> #p.cum.death (Casos totales  fallecidos)
> #p.death.100hab (Casos NUEVOS  fallecidos by 10e5 hab)
> #p.Recup (Casos NUEVOS  recuperados)
> #p.cum.Recup (Casos totales  recuperados)
> #p.Recup.100hab (Casos NUEVOS  recuperados by 10e5 hab)
⇢DAY: 2020/4/1 extraordinary(+) measures in Spain
Efron.r.squared>0.9 (parametric model coefficient of determination)
Cases in Spain projection:


vertical yellow line: today, vetical red line: day of inflection in number of cases, vertical green lines: days to reach maximum number of cases (90, 95 and 99%)
Deaths in Spain projection:


vertical yellow line: today, vetical red line: day of inflection in number of cases, vertical green lines: days to reach maximum number of cases (90, 95 and 99%)
Cases/Deaths in Spain projection statistics next days:
          Date              Total_Cases Cases_10e5          Total_Deaths Deaths_10e5
95  2020-04-01 [7354,(CI95%:7352-7356)]         16 [800,(CI95%:798-802)]           2
96  2020-04-02 [7282,(CI95%:7281-7284)]         15 [779,(CI95%:777-781)]           2
97  2020-04-03 [7214,(CI95%:7212-7216)]         15 [757,(CI95%:755-758)]           2
98  2020-04-04 [7107,(CI95%:7106-7109)]         15 [735,(CI95%:733-737)]           2
99  2020-04-05 [6993,(CI95%:6991-6995)]         15 [713,(CI95%:711-715)]           2
100 2020-04-06 [6891,(CI95%:6889-6893)]         15 [693,(CI95%:691-695)]           1
101 2020-04-07 [6716,(CI95%:6714-6718)]         14 [670,(CI95%:668-672)]           1
102 2020-04-08 [6408,(CI95%:6406-6410)]         14 [642,(CI95%:640-644)]           1
103 2020-04-09 [5973,(CI95%:5971-5975)]         13 [605,(CI95%:603-607)]           1
104 2020-04-10 [5483,(CI95%:5481-5485)]         12 [559,(CI95%:557-561)]           1
105 2020-04-11 [5017,(CI95%:5015-5019)]         11 [512,(CI95%:510-514)]           1
106 2020-04-12 [4554,(CI95%:4552-4556)]         10 [467,(CI95%:465-469)]           1
107 2020-04-13 [4097,(CI95%:4095-4099)]          9 [421,(CI95%:419-423)]           1
108 2020-04-14 [3652,(CI95%:3650-3654)]          8 [377,(CI95%:375-379)]           1
109 2020-04-15 [3226,(CI95%:3224-3228)]          7 [334,(CI95%:332-336)]           1
110 2020-04-16 [2824,(CI95%:2822-2826)]          6 [294,(CI95%:292-296)]           1
111 2020-04-17 [2449,(CI95%:2447-2451)]          5 [256,(CI95%:254-258)]           1
112 2020-04-18 [2105,(CI95%:2103-2107)]          4 [221,(CI95%:219-223)]           0
113 2020-04-19 [1792,(CI95%:1790-1794)]          4 [189,(CI95%:187-191)]           0
114 2020-04-20 [1512,(CI95%:1510-1514)]          3 [160,(CI95%:158-162)]           0
# VARIABLES:
# "Date=Next days prediction"; "Total_Cases=Cases for Catalonia",
# "Cases_10e5=Cases for Catalonia in 100000 hab";"Severity_10e5=Severity Cases for Catalonia in 100000 hab";
# "Total_Deaths=Total deaths for Catalonia";"Deaths_10e5 = Deaths for Catalonia in 100000 hab"
Prediction for Catalonia : cumulated cases, severity cases and deaths.
Cases in Catalonia projection:


vertical yellow line: today, vetical red line: day of inflection in number of cases, vertical green lines: days to reach maximum number of cases (90, 95 and 99%)
Deaths in Catalonia projection:


vertical yellow line: today, vetical red line: day of inflection in number of cases, vertical green lines: days to reach maximum number of cases (90, 95 and 99%)
| ||||
| Date.NextDays p.casos p.cum.casos p.casos.100hab p.Hosp p.Hosp.100hab p.UCI p.UCI.100hab p.death p.death.100hab p.Recup p.Recup.100hab
43 2020-04-02 1554 24021 21 1178 16 137 2 246 3 1011 13
44 2020-04-03 1371 25392 18 1059 14 124 2 250 3 1084 14
45 2020-04-04 1171 26563 16 912 12 109 1 258 3 1178 16
46 2020-04-05 1002 27565 13 772 10 94 1 275 4 1308 17
47 2020-04-06 841 28406 11 643 9 80 1 306 4 1473 20
48 2020-04-07 692 29098 9 530 7 65 1 339 5 1609 21
49 2020-04-08 561 29659 7 430 6 52 1 360 5 1663 22
VARIABLES: p.casos (New cases predicted) p.cum.casos (Total cases predicted) p.casos.100hab (New cases predicted by 10e5 hab) p.Hosp (Nuevos casos hospitalizados) p.Hosp.100hab (Nuevos casos hospitalizados by 10e5 hab) p.UCI (Nuevos casos UCI) p.UCI.100hab (Nuevos casos UCI by 10e5 hab) p.death (Nuevos casos fallecidos) p.death.100hab (Nuevos casos fallecidos by 10e5 hab) p.Recup (Nuevos casos recuperados) p.Recup.100hab (Nuevos casos recuperados by 10e5 hab) | ||||
⇢DAY: 2020/3/31 extraordinary(+) measures in Spain
Efron.r.squared>0.9 (parametric model coefficient of determination)
Cases in Spain projection:


vertical yellow line: today, vetical red line: day of inflection in number of cases, vertical green lines: days to reach maximum number of cases (90, 95 and 99%)
Deaths in Spain projection:
Efron.r.squared>0.9 (parametric model coefficient of determination)


vertical yellow line: today, vetical red line: day of inflection in number of cases, vertical green lines: days to reach maximum number of cases (90, 95 and 99%)
Prediction for Catalonia : cumulated cases, severity cases and deaths.


vertical yellow line: today, vetical red line: day of inflection in number of cases, vertical green lines: days to reach maximum number of cases (90, 95 and 99%)
"Next 20 days prediction of coronavirus cases in Catalonia. T. Monleon (BIOST3-UB"

"----------------------------------------------------------------------------------"

         Date              Total_Cases Cases_10e5 Severity_10e5          Total_Deaths Deaths_10e5
37 2020-04-01 [1580,(CI95%:1578-1582)]         21             0 [265,(CI95%:263-267)]           4
38 2020-04-02 [1563,(CI95%:1561-1565)]         21             0 [294,(CI95%:292-296)]           4
39 2020-04-03 [1548,(CI95%:1546-1550)]         21             0 [314,(CI95%:312-316)]           4
40 2020-04-04 [1641,(CI95%:1639-1643)]         22             0 [332,(CI95%:330-333)]           4
41 2020-04-05 [1819,(CI95%:1817-1821)]         24             1 [350,(CI95%:348-352)]           5
42 2020-04-06 [2060,(CI95%:2058-2062)]         27             2 [376,(CI95%:374-378)]           5
43 2020-04-07 [2140,(CI95%:2138-2142)]         29             3 [430,(CI95%:428-432)]           6
44 2020-04-08 [2142,(CI95%:2140-2144)]         29             3 [542,(CI95%:540-544)]           7
45 2020-04-09 [2155,(CI95%:2153-2157)]         29             3 [692,(CI95%:690-694)]           9
46 2020-04-10 [2144,(CI95%:2142-2146)]         29             3 [796,(CI95%:794-798)]          11
47 2020-04-11 [2107,(CI95%:2105-2109)]         28             3 [840,(CI95%:838-842)]          11
48 2020-04-12 [2078,(CI95%:2076-2080)]         28             2 [853,(CI95%:851-855)]          11
49 2020-04-13 [2054,(CI95%:2052-2056)]         27             2 [853,(CI95%:851-855)]          11
50 2020-04-14 [2011,(CI95%:2009-2013)]         27             2 [851,(CI95%:849-853)]          11
51 2020-04-15 [1950,(CI95%:1948-1952)]         26             2 [879,(CI95%:877-881)]          12
52 2020-04-16 [1870,(CI95%:1868-1872)]         25             2 [851,(CI95%:849-853)]          11
53 2020-04-17 [1772,(CI95%:1770-1774)]         24             1 [816,(CI95%:814-818)]          11
54 2020-04-18 [1657,(CI95%:1655-1659)]         22             1 [776,(CI95%:774-778)]          10
55 2020-04-19 [1522,(CI95%:1520-1524)]         20             0 [731,(CI95%:729-733)]          10
56 2020-04-20 [1375,(CI95%:1373-1377)]         18            -1 [681,(CI95%:680-683)]           9
"----------------------------------------------------------------------------------"
 VARIABLES:
"Date=Next days prediction"; "Total_Cases=Cases for Catalonia",
"Cases_10e5=Cases for Catalonia in 100000 hab";"Severity_10e5=Severity Cases for Catalonia in 100000 hab";
"Total_Deaths=Total deaths for Catalonia";"Deaths_10e5 = Deaths for Catalonia in 100000 hab"
"----------------------------------------------------------------------------------"
⇢DAY: 2020/3/29 extraordinary(+) measures in Spain
New algorithm improved to compute projections
Cases in Spain projection:
Efron.r.squared=0.995 (parametric model coefficient of determination)
"Maximum number of accumulated cases. Mean=147647,CI95% = (147408-147882)"
"Parameters cum cases W(X). c=-59.3,d=13.1,
Time to reach maximum number of accumulated cases = day90%=99, day95%=101, day99%=105"

 vertical yellow line: today, vetical red line: day of inflection in number of cases, vertical green lines: days to reach maximum number of cases (90, 95 and 99%)


Deaths in Spain projection:
"Maximum number of accumulated cases. Mean=14252,CI95% = (14014-14482)"
"Parameters cum cases W(X). c=-74.6,d=16.4,
time to reach maximum number of accumulated cases =day90%=98, day95%=100, day99%=102"


vertical yellow line: today, vetical red line: day of inflection in number of cases, vertical green lines: days to reach maximum number of cases (90, 95 and 99%)
Prediction for Catalonia : cumulated cases, severity cases and deaths.
"Maximum number of accumulated cases. Mean=26135,CI95% = (26021-26374)" "Parameters cum cases W(X). c=-13.6,d=3.9, day90%=42, day95%=45, day99%=50"
Cum Cases for the next days: 

vertical yellow line: today, vetical red line: day of inflection in number of cases, vertical green lines: days to reach maximum number of cases (90, 95 and 99%)
Cases for the next days:


vertical yellow line: today, vertical red line: day of inflection in number of cases, vertical green lines: days to reach maximum number of cases (90, 95 and 99%)
Yellow marker: maximum expected 29/3/20 - 31/3/20
Total cases prediction for next days (Catalonia)
magenta line: worst scenario (Cases next days: 1247 1246 1213 1134 1008 861 724 603 493 396 312 241 182)
Cases per 100000 citizens prediction for next days (Catalonia)
red line: worst scenario (Cases next days: 17 17 16 15 13 11 10 8 7 5
⇢DAY: 2020/3/27 extraordinary measures in Spain
PREDICTION [worst scenario]: Maximum cases = 100000 (time to reach maximum number of accumulated cases = +94days = first April (90% maximum), +95 days (95% maximum), +97days (99% maximum)). Today = day 89, Reference = 2019/12/31 [1st day]
Efron.r.squared=0.992 (parametric model coefficient of determination)


BLUE: cum deaths , magenta: cases
Prediction for Catalonia : cumulated cases, severity cases and deaths.


Yellow marker: maximum expected 29/3/20 - 31/3/20
Total cases prediction for next days (Catalonia)
red line: worst scenario (Cases next days:
1671 1704 1715 1703 1666 1605 1522 1420 1301 1170
magenta line: average scenario (worst-best scenarios) (Cases next days:
1598 1560 1473 1338 1178 1033 897 776 671 576
Cases per 100000 citizens prediction for next days (Catalonia)
red line: worst scenario (Cases next days:
22 23 23 23 22 21 20 19 17 16
magenta line: average scenario (worst-best scenarios) (Cases next days:
21 21 20 18 16 14 12 10 9 8
Severity Cases per 100000 citizens prediction for next days (Catalonia)
red line: worst scenario (Cases next days:
1 1 1 1 1 0 0 0 0 0
magenta line: average scenario (worst-best scenarios) (Cases next days:
0 0 0 0 0 0 0 0 0 0
⇢DAY: 2020/3/26 extraordinary measures in Spain
PREDICTION [worst scenario]: Maximum cases = 100000 (time to reach maximum number of accumulated cases = +94days = first April (90% maximum), +95 days (95% maximum), +97days (99% maximum)). Reference = 2019/12/31 [1st day]
Efron.r.squared=0.99 (parametric model coefficient of determination)


Prediction for Catalonia : cumulated cases, severity cases and deaths.


red line: cases predicted worst scenario, magenta line: cases predicted average scenario
Yellow marker: maximum expected 28/3/20 - 31/3/20
Total cases prediction for next days (Catalonia)
red line: worst scenario (Cases next days:
4013 4429 4644 4579 4194 3518 2654 1765 1009 483
magenta line: average scenario (worst-best scenarios) (Cases next days:
2930 3122 3136 2918 2467 1890 1379 860 476 221
Cases per 100000 citizens prediction for next days (Catalonia)
red line: worst scenario (Cases next days:
54 59 62 61 56 47 35 24 13 6
magenta line: average scenario (worst-best scenarios) (Cases next days:
39 42 42 39 33 25 18 11 6 3
Severity Cases per 100000 citizens prediction for next days (Catalonia)
red line: worst scenario (Cases next days:
12 13 14 14 12 9 5 1 0 0
magenta line: average scenario (worst-best scenarios) (Cases next days:
6 7 7 6 4 2 0 0 0
⇢DAY: 2020/3/25 extraordinary measures in Spain
PREDICTION [worst scenario]: Maximum cases = 90000 (time to reach maximum number of accumulated cases = +94days = first April (90% maximum), +94 days (95% maximum), +96days (99% maximum)). Reference = 2019/12/31 [1st day]
Efron.r.squared=1 (parametric model coefficient of determination)


Prediction for Catalonia : cumulated cases, severity cases and deaths.
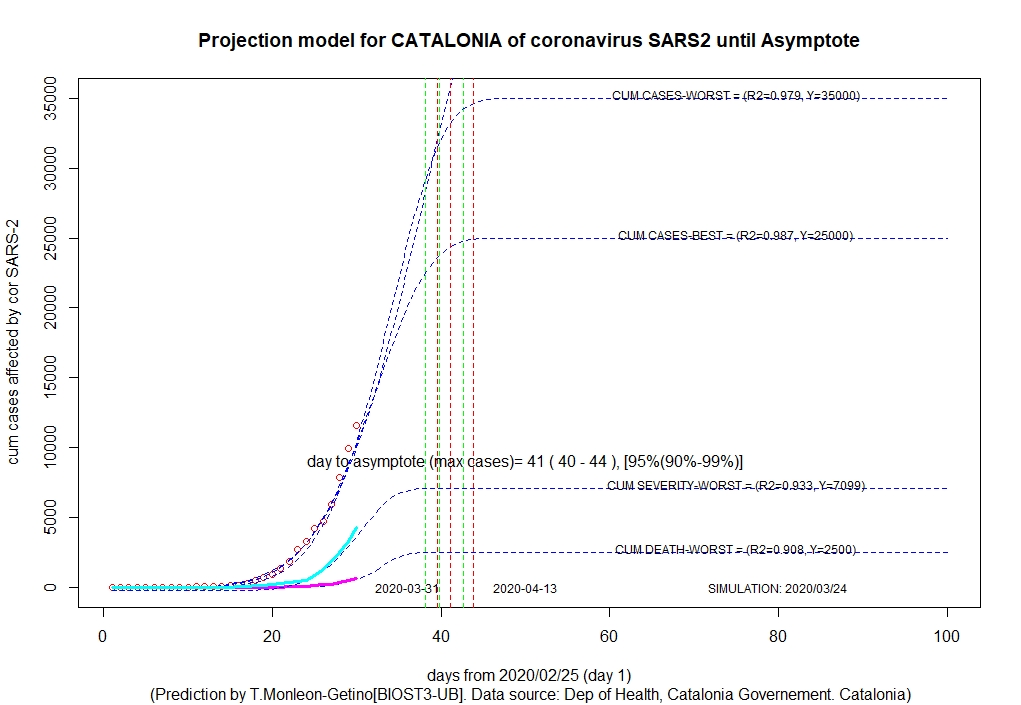

Dayly predictions for the next days in Catalonia: 26/3, 27/3, 28/3, ..
Yellow marker: maximum expected 1/4/20 - 3/4/20
Total cases prediction for next days (Catalonia)
red line: worst scenario (Cases next days:
1831 2001 2162 2305 2426 2518 2574 2590 2562 2489 2371 2213 2019 1800 1563 1322 1085 864 665 494 354 243 160 101 60 34 18 9
magenta line: average scenario (worst-best scenarios) (Cases next days:
1913 2049 2116 2137 2104 2019 1885 1715 1521 1318 1121 939 778 640 522 420 333 258 194 140 98 66 42 26 15 8 4 2
Cases per 100000 citizens prediction for next days (Catalonia)
red line: worst scenario (Cases next days:
24 27 29 31 32 34 34 35 34 33 32 30 27 24 21 18 14 12 9 7 5 3 2 1
magenta line: average scenario (worst-best scenarios) (Cases next days:
26 27 28 28 28 27 25 23 20 18 15 13 10 9 7 6 4 3 3 2 1 1 1 0
Severity Cases per 100000 citizens prediction for next days (Catalonia)
red line: worst scenario (Cases next days:
1 2 3 4 4 5 5 5 5 4 4 3 2 1 0
magenta line: average scenario (worst-best scenarios) (Cases next days:
2 2 3 3 3 2 2 1 0
⇢DAY: 2020/3/24 extraordinary measures in Spain
PREDICTION [worst scenario]: Maximum cases = 80000 (time to reach maximum number of accumulated cases = +107days = May (90% maximum), +111 days (95% maximum), +119days (99% maximum)). Reference = 2019/12/31 [1st day]
Efron.r.squared=0.912 (parametric model coefficient of determination)


Prediction for Catalonia : cumulated cases, severity cases and deaths.

Prediction of number of cases for the next days:

Dayly predictions for the next days in Catalonia: 25/3, 26/3, 27/3, ..
Yellow marker: maximum expected 30/3/20 - 1/4/20
Total cases prediction for next days (Catalonia)
red line: worst scenario (Cases next days:
2392 2685 2955 3181 3344 3423 3402 3273 3037 2706 2306 1869 1433 1034 697 435 250 131 62 27 10 3 1 0 0 0 0 0 0 0 0 0 0
magenta line: average scenario (worst-best scenarios) (Cases next days:
2309 2468 2540 2521 2414 2240 2023 1788 1545 1301 1056 819 601 414 266 157 85 42 18 7 2 1 0 0 0 0 0 0 0 0 0 0 0
Cases per 100000 citizens prediction for next days (Catalonia)
red line: worst scenario (Cases next days:
32 36 39 42 45 46 45 44 40 36 31 25 19 14 9 6 3 2 1 0 0 0 0 0 0 0 0 0 0 0 0 0 0 0 0 0 0 0 0 0 0 0 0 0 0 0 0 0 0 0 0 0 0 0 0 0 0 0 0 0 0 0 0 0 0 0 0 0 0 0 0 0
magenta line: average scenario (worst-best scenarios) (Cases next days:
31 33 34 34 32 30 27 24 21 17 14 11 8 6 4 2 1 1 0 0 0 0 0 0 0 0 0 0 0 0 0 0 0 0 0 0 0 0 0 0 0 0 0 0 0 0 0 0 0 0 0 0 0 0 0 0 0 0 0 0 0 0 0 0 0 0 0 0 0 0 0
Severity Cases per 100000 citizens prediction for next days (Catalonia)
red line: worst scenario (Cases next days:
4 5 6 7 8 9 8 8 7 5 4 2 0
magenta line: average scenario (worst-best scenarios) (Cases next days:
4 4 5 5 4 3 2 1 0 0 0
⇢DAY: 2020/3/23 extraordinary measures in Spain
PREDICTION [worst scenario]: Maximum cases = 58000 (time to reach maximum number of accumulated cases = +110days = May (90% maximum), +116 days (95% maximum), +128 days (99% maximum)). Reference = 2019/12/31 [1st day]
Efron.r.squared=0.862 (parametric model coefficient of determination)


Prediction for Catalonia : cumulated cases, severity cases and deaths.

Prediction of number of cases for the next days:

Dayly predictions for the next days in Catalonia: 24/3, 25/3, 26/3, ..
Yellow marker: maximum expected 1/4/20 - 4/4/20
Total cases prediction for next days (Catalonia)
red line: worst scenario (Cases next days: 1847 2116 2397 2685 2973 3251 3508 3733 3913 4036 4092 4072 3971 3790 3534 3213 2842 2441 2031 1632 1265 941 671 457 296 182 105 58 29 14 6 3)
magenta line: average scenario (worst-best scenarios) (Cases next days: 1274 1314 1446 1555 1658 1751 1830 1892 1931 1944 1929 1884 1808 1702 1571 1418 1252 1079 907 744 595 466 358 271 203 153 115 88 68 54 42 33)
Cases per 100000 citizens prediction for next days (Catalonia)
red line: worst scenario (Cases next days: 25 28 32 36 40 43 47 50 52 54 55 54 53 51 47 43 38 33 27 22 17 13 9 6 4 2 1 1 0 0 0 0 0 0 0 0 0 0 0 0 0 0 0 0 0 0 0 0 0 0 0 0
[53] 0 0 0 0 0 0 0 0 0 0 0 0 0 0 0 0 0 0 0 0 0 )
magenta line: average scenario (worst-best scenarios) (Cases next days: 17 18 19 21 22 23 24 25 26 26 26 25 24 23 21 19 17 14 12 10 8 6 5 4 3 2 2 1 1 1 1 0 0 0 0 0 0 0 0 0 0 0 0 0 0 0 0 0 0 0 0 0 0 0 0 0 0 0 0 0 0 0 0 0 0 0 0 0 0 0 0 0 )
Severity Cases per 100000 citizens prediction for next days (Catalonia)
red line: worst scenario (Cases next days: 2 3 4 5 7 8 9 10 11 12 12 12 11 11 9 8 6 4 2 1 0 0 0 0 0 0 0 0 0 0 0 0 0 0 0 0)
magenta line: average scenario (worst-best scenarios) (Cases next days: 0 0 0 0 1 1 1 2 2 2 2 2 1 1 0 0 0 0 0 0 0 0 0 0 0 0 0 0 )
⇢DAY: 2020/3/22 extraordinary measures in Spain
PREDICTION [worst scenario]: Maximum cases = 50000 (time to reach maximum number of accumulated cases = +114days = May (90% maximum), +122 days (95% maximum), +137 days (99% maximum)). Reference = 2019/12/31 [1st day]
Efron.r.squared=0.817 (parametric model coefficient of determination)

Prediction of next days cases for Spain with CI95% and maximum number of deaths

red: real cases, magenta: predicted cases (with CI95%), cyan: real cum
deaths , blue: predicted cum deaths, yellow: real deaths.
Prediction for Catalonia : cumulated cases, severity cases and deaths.
Efron.r.squared=0.999 (parametric model coefficient of determination)


⇢DAY: 2020/3/21 extraordinary measures in Spain


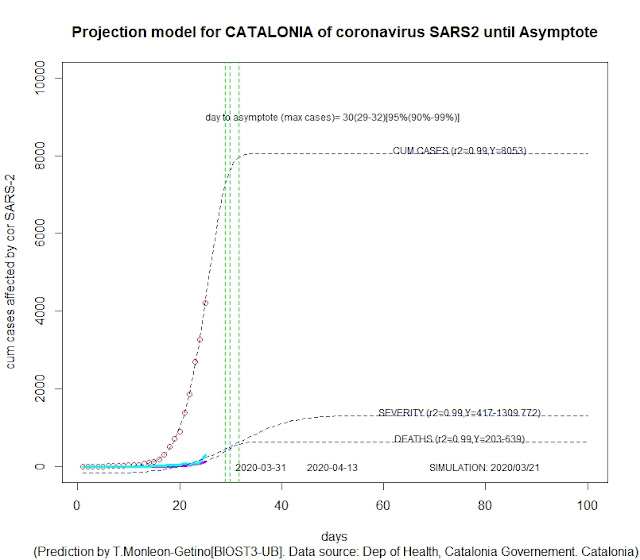

⇢DAY: 2020/3/20 extraordinary measures in Spain

CUMULATED CASES,


⇢DAY: 2020/3/18 extraordinary measures in Spain
PREDICTION [worst scenario]: Maximum cases = 50000 (time to reach maximum number of accumulated cases = +117days = May (90% maximum), +124 days (95% maximum), +137 days (99% maximum)). Reference = 2019/12/31 [1st day]
Efron.r.squared=0.847 (parametric model coefficient of determination)


red:
real cases, magenta: predicted cases (with CI95%), cyan: real cum
deaths , blue: predicted cum deaths, yellow: real deaths.
Prediction for Catalonia : cumulated cases, severity cases and deaths.
Efron.r.squared=0.999 (parametric model coefficient of determination)

Catalonia. Severity and cases by 100000 citizens for the next days

cyan: severity cases real-projected, red: cases real-projected. Number under the line cases estimated by 100000 citizens for the next days.
⇢DAY: 2020/3/20 extraordinary measures in Spain
PREDICTION [worst scenario]: Maximum cases = 35000 (time to reach maximum number of accumulated cases = +108days = first-May (90% maximum), +114days (95% maximum), +116 days (99% maximum)). Reference = 2019/12/31 [1st day]
Efron.r.squared=0.825 (parametric model coefficient of determination)

blue line: cases, cyan line: deaths
CASES FOR NEXT WEEKS:
red: real cases, magenta: predicted cases (with CI95%), cyan: real cum deaths , blue: predicted cum deaths, yellow: real deaths. 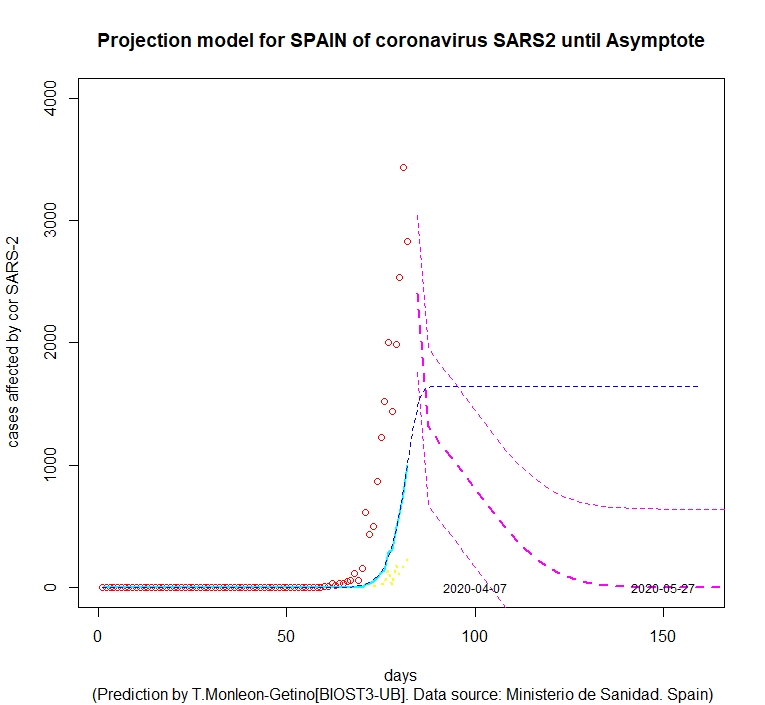
⇢DAY: 2020/3/19 extraordinary measures in Spain
PREDICTION [worst scenario]: Maximum cases = 45000 (time to reach maximum number of accumulated cases = +116days = April (90% maximum), +123days (95% maximum), +137 days (99% maximum)). Reference = 2019/12/31 [1st day]
Efron.r.squared=0.822 (parametric model coefficient of determination)
CUMULATED CASES,

blue line: cases, cyan line: deaths
CASES FOR NEXT WEEKS

⇢DAY: 2020/3/18 extraordinary measures in Spain
PREDICTION [worst scenario]: Maximum cases = 35000 (time to reach maximum number of accumulated case s = +83days = April22th(90% maximum), +89 days (95% maximum), +102 days (99% maximum)). Reference = 2020/1/31 [1st day]
Efron.r.squared=0.741 (parametric model coefficient of determination)

⇢DAY: 2020/3/17 extraordinary measures in Spain
PREDICTION [worst scenario]: Maximum cases = 35000 (time to reach maximum number of accumulated case s = +83days = April22th(90% maximum), +89 days (95% maximum), +102 days (99% maximum)). Reference = 2020/1/31 [1st day]
Efron.r.squared=0.717 (parametric model coefficient of determination)

⇢DAY: 2020/3/16 extraordinary measures in Spain
PREDICTION [worst scenario]: Maximum cases = 35000 (time to reach maximum number of accumulated case s = +83days = April22th(90% maximum), +89 days (95% maximum), +101 days (99% maximum)). Reference = 2020/1/31 [1st day]
Efron.r.squared=0.633 (parametric model coefficient of determination)


⇢DAY: 2020/3/15: extraordinary measures in Spain
PREDICTION [worst scenario]: Maximum cases = 35621 (time to reach maximum number of accumulated case s = +84days = end of April?(90% maximum), +90 days (95% maximum), +101 days (99% maximum)). Reference = 2020/1/31 [1st day]
Efron.r.squared=0.733 (parametric model coefficient of determination)

⇢DAY: 2020/3/14: extraordinary measures in Spain
PREDICTION [worst scenario]: Maximum cases = 31875 (time to reach maximum number of accumulated case s = +85days = end of April?(90% maximum), +91 days (95% maximum), +101 days (99% maximum)). Reference = 2020/1/31 [1st day]
Efron.r.squared=0.737 (parametric model coefficient of determination)

⇢DAY: 2020/3/13: extraordinary measures in Spain

PREDICTION [intermediate scenario]: Maximum cases = 13333.33 (time to reach maximum number of accumulated case s = +79.45days = end of April?(90% maximum), +84.85 days (95% maximum), +94.48 days (99% maximum)). Reference = 2020/1/31 [1st day]
Efron.r.squared=0.556 (parametric model coefficient of determination)
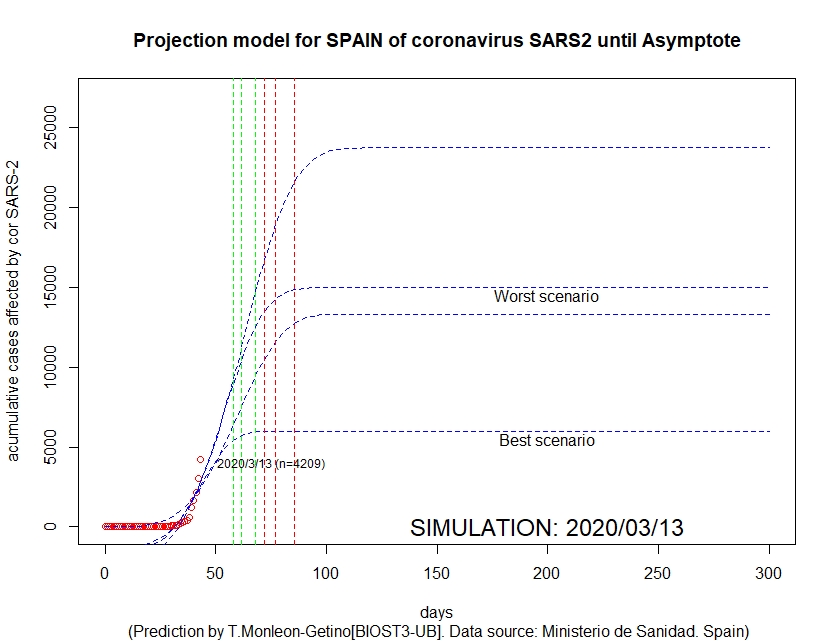
⇢DAY: 2020/3/13:
Prediction of >6000 cases in two weeks, worst scenary 15000 cases

⇢DAY: 2020/3/7:
prediction between 4000-8000 cases

MORE INFORMATION OF PREDICTION, MODELS ABOUT CORONAVIRUS IN SPAIN
2020/03/16

DATA-NEWS
Consult daily data in: https://www.epdata.es/datos/coronavirus-china-datos-graficos/498
Information obtained from
Data from Spain:
Daily evolution in the world: El mapa del coronavirus: así crecen los casos día a día y país por país: https://elpais.com/sociedad/2020/03/12/actualidad/1584000830_523359.html
Tots els mapes per seguir l'evolució del coronavirus a Catalunya, Espanya i el món - http://ara.cat/_90009a4c?s=e
Download today’s data on the geographic distribution of COVID-19 cases worldwide
Catalonia data of cases, deaths and severity. https://www.naciodigital.cat/noticia/198469/grafic/interactiu/aixi/evoluciona/coronavirus/catalunya/dia/dia
Wikipedia. Coronavirus in Spain. https://en.wikipedia.org/wiki/2020_coronavirus_pandemic_in_Spain
Institute Superiori di Sanita. Statistics of Coronavirus in Italy (Statrification by age and sex):. https://en.wikipedia.org/wiki/Template:2019%E2%80%9320_coronavirus_pandemic_data/Italy_medical_cases
NEWS & INFORMATIONS
03/05/2020:
Identifying changes in the reproduction number, rate of spread, and
doubling time during the course of the COVID-19 outbreak whilst
accounting for potential biases due to delays in case reporting both
nationally and subnationally. These results are impacted by changes in
testing effort, increases and decreases in testing effort will increase
and decrease reproduction number estimates respectively (see Methods for
further explanation).
https://epiforecasts.io/covid/posts/global/
15/4/2020 https://amp.theguardian.com/world/2020/apr/12/coronavirus-statistics-what-can-we-trust-and-what-should-we-ignore?CMP=share_btn_tw&__twitter_impression=true
2021/03/21 (Thanks David Serrano): https://www.20minutos.es/noticia/4195117/0/asi-crecera-numero-infectados-coronavirus-espana-segun-modelos-matematicos/
2021/03/21 Model of evolution coronavirus in function of statrategy. https://medium.com/@tomaspueyo/coronavirus-the-hammer-and-the-dance-be9337092b56
2021/03/21: Mas modelos https://medium.com/@carlosbort/coronavirus-podr%C3%ADa-haber-hasta-100-veces-m%C3%A1s-contagiados-de-los-reportados-7f54cbcdeec
2020/03/20 https://www.consalud.es/pacientes/especial-coronavirus/cuales-grupos-riesgo-coronavirus-indice-mortalidad-presenta-uno_74816_102.html
"El 81% de los casos son leves y superan sin ningún problema
la enfermedad. Es potencialmente peligroso en personas mayores de 80
años o con patologías cardiovasculares, respiratorias o inmunológicas
previas" "Los datos estadísticos aportados por los investigadores chinos del
Equipo Epidemiológico de Respuesta de Emergencia a la Neumonía del Nuevo
Coronavirus, tras analizar más de 70.000 pacientes afectados, apuntan
que el 81% de los casos son leves, el 13,8% son graves y un exiguo 4,7% son críticos. A este último grupo pertenecen los mayores de 80 años, en los que el virus alcanza un 14,8% de mortalidad. Estas son las tasas por grupos de edad: En los afectados de entre 10 y 49 años se ha registrado un índice de mortalidad de entre el 0,2% y 0,4%.
Solo hay tasas superiores al 1% en las personas que mayores de 50 años.
Se eleva al 3,6% en las personas de entre 60 y 69 años y hasta el 8% en
edades comprendidas entre los 70 y los 79 años. Hasta el momento, los
niños parecen estar a salvo de los efectos más graves ya que ninguno ha
fallecido a causa del virus.MÁS HOMBRES QUE MUJERES Este seguimiento muestra que en los grupos más jóvenes la mortalidad
del virus es el doble que la de una gripe común, que ha causado la
muerte a más hombres que mujeres (un 2,8% frente a un 1,7%), y que
afecta especialmente a las personas con enfermedades previas,
sobre todo de tipo cardiovascular (un 10% de la mortalidad), diabetes
(un 7,3% de mortalidad) y afecciones respiratorias crónicas (un 6,3%).2021/03/21 Model of evolution coronavirus in function of statrategy. https://medium.com/@tomaspueyo/coronavirus-the-hammer-and-the-dance-be9337092b56
- Los contagiados reales pueden ser del orden de 500.000 personas. Esto es, 100 veces más de los actuales confirmados a fecha 17 de marzo.
- La capacidad de realizar el test no crece a la misma velocidad que los contagios. Por eso el crecimiento de contagiados diagnosticado es cuasi-imposible que siga una exponencial.
- Intentar calcular el valor de contagiados real exacto es imposible, porqué deberíamos realizar tests a todos los ciudadanos. No sabemos el valor real. Una forma de aproximarla sería enfocar el problema como uno de muestreo aleatorio y buscar una muestra representativa. Metodología de encuestas.
- Los modelos son muy sensibles a los parámetros estimados. Para entenderlo en más detalle y cómo se suaviza la exponencial a la logística, este video lo explica.
- Muchas de las hipótesis actuales están realizadas con papers de médicos chinos. Los hospitales Españoles que están padeciendo la crisis están desbordados salvando vidas y la recogida de datos cae obviamente en otro plano. Cualquier ayuda que se pueda hacer en este tema, bienvenida.
- Ministerio de Sanidad, ¡necesitamos más datos por favor!
2021/03/21: Mas modelos https://medium.com/@carlosbort/coronavirus-podr%C3%ADa-haber-hasta-100-veces-m%C3%A1s-contagiados-de-los-reportados-7f54cbcdeec
2020/03/20 https://www.consalud.es/pacientes/especial-coronavirus/cuales-grupos-riesgo-coronavirus-indice-mortalidad-presenta-uno_74816_102.html
Si analizamos los datos en conjunto, todo ello resulta en una mortalidad general del 2,3%, una cifra que se alinea con los datos que ya se venían manejando. No obstante, La Organización Mundial de la Salud (OMS) ha informado que esa tasa de mortalidad se corresponde más con la realidad de Wuhan que con la del resto del mundo, donde el índice se queda en un 0,7%."
2020/03/18. Climical trial solidarity WHO. What is the best strategy to stop coronavirus? https://www.elperiodico.com/es/sociedad/20200318/ensayo-clinico-mundial-tratamiento-mas-eficaz-coronavirus-7895656
https://www.lavanguardia.com/vida/20200318/474249568746/oms-marcha-ensayo-clinico-mundial-tratamiento-eficaz-coronavirus.html
2020/03/17: Imperial College of London prediction https://elpais.com/ciencia/2020-03-17/un-informe-advierte-de-que-las-medidas-de-distanciamiento-social-podrian-ser-necesarias-hasta-18-meses.html
https://www.imperial.ac.uk/media/imperial-college/medicine/sph/ide/gida-fellowships/Imperial-College-COVID19-NPI-modelling-16-03-2020.pdf
"Los autores analizan con modelos epidemiológicos las dos
estrategias contra el coronavirus que hay sobre la mesa: la de
mitigación, planteada en un primer momento por Reino Unido
para ralentizar, pero no detener, la propagación de la epidemia, y la
de supresión de la transmisión, como se intenta ahora en España y en
Italia con medidas drásticas de encierro en los hogares y el ejército en
las calles.
Los científicos, liderados por el epidemiólogo Neil Ferguson,
recomiendan la estrategia de supresión, pero advierten de que será
necesario “mantener las medidas, al menos de manera intermitente,
mientras el virus circule por la población o hasta que haya una vacuna
disponible”. En el caso de la Covid-19, “se necesitarán al menos unos
12-18 meses antes de que tengamos una vacuna”. Además, alertan, “no hay
garantía de que las primeras vacunas tengan una eficacia alta”. Este
lunes empezó un ensayo clínico de una posible vacuna llevado a cabo por los Institutos Nacionales de la Salud de EE UU y la empresa biotecnológica Moderna."
2020/03/17:Report of the WHO-China Joint Mission on Coronavirus Disease 2019 (COVID-19) https://www.who.int/docs/default-source/coronaviruse/who-china-joint-mission-on-covid-19-final-report.pdf
More cases than confirmed,

2020/03/17: New paper in Scence (Thanks Noelia Fernandez and Jordi García !)
https://science.sciencemag.org/content/early/2020/03/13/science.abb3221
Abstract: Estimation
of the prevalence and contagiousness of undocumented novel coronavirus
(SARS-CoV2) infections is critical for understanding the overall
prevalence and pandemic potential of this disease. Here we use
observations of reported infection within China, in conjunction with
mobility data, a networked dynamic metapopulation model and Bayesian
inference, to infer critical epidemiological characteristics associated
with SARS-CoV2, including the fraction of undocumented infections and
their contagiousness. We estimate 86% of all infections were
undocumented (95% CI: [82%–90%]) prior to 23 January 2020 travel
restrictions. Per person, the transmission rate of undocumented
infections was 55% of documented infections ([46%–62%]), yet, due to
their greater numbers, undocumented infections were the infection source
for 79% of documented cases. These findings explain the rapid
geographic spread of SARS-CoV2 and indicate containment of this virus
will be particularly challenging.
2020/03/16: "Hay muchos modelos matemáticos que simulan el comportamiento de el
Covid-19 y tratan de predecir su evolución. No se han pronunciado
claramente al respecto de la estacionalidad. Los epidemiólogos solemos
decir que todos estos modelos están equivocados, pero algunos son
útiles. La estacionalidad supondría que el nuevo coronavirus se quedase
entre nosotros y reapareciese cada temporada, probablemente con algunas
características distintas en años sucesivos, en los que habría también
más población inmune. Si esta nueva enfermedad se comporta o no como una
enfermedad estacional, lo sabremos sólo cuando llegue la primavera" . Dr A. Trilla 2020/03/16: Temporal variation in transmission during the COVID-19 outbreak - Centre for Mathematical Modelling of Infectious Diseases
https://cmmid.github.io/topics/covid19/current-patterns-transmission/global-time-varying-transmission.html

Scenarios simulation with 200 people coronavirus infection (scenario 1: with social contact, without confinement, scenario 2 no social contact, confinement)
Scenario 1: with social contact, without confinement,Asymptotic curve with exponential growth of great slope

Scenario 2 no social contact, confinement. Asymptotic curve with exponential growth with little slope

2020/03/15 Prediction coronavirus using Kalman filter: https://towardsdatascience.com/using-kalman-filter-to-predict-corona-virus-spread-72d91b74cc8
2020/03/16:https://www.nytimes.com/2020/03/01/health/coronavirus-washington-spread.html
Coronavirus May Have Spread in U.S. for Weeks, Gene Sequencing Suggests
Two
cases detected weeks apart in Washington State had genetic links,
suggesting that many more people in the area may be infected.
2020/03/15 Here's How Fast the Coronavirus Could Infect Over 1 Million Americans. https://time.com/5801726/coronavirus-models-forecast/

Video about measures adopted in Spain:
|
Probabilistic gaussian models and simulations can help authorities to deal with coronavirus:


REFERENCES
- BDSbiost3: Machine learning and advanced statistical methods for omic, categorical analysis and others. Library for R published in github. 2020. T Monleon-Getino Link: https://github.com/amonleong/BDSbiost3
- Big Data. Hacia la cuarta revolución industrial. 2019. T Monleon-Getino, E Vegas, R F. Edicions Universitat de Barcelona
- Use of non-linear mixed-effects modelling and regression analysis to predict the number of somatic coliphages by plaque enumeration after 3 hours of incubation. J Mendez, A Monleon-Getino, J Jofre, F Lucena. 2017. Journal of water and health 15 (5), 706-717
- Probabilitat i estadística per a ciències II-.T Monleón-Getino, CR Casado.Edicions Universitat Barcelona
- Causality in Medicine and Its Relationship with the Role of Statistics. 2017. A Monleon-Getino, J Canela Soler. Biomedical Statistics and Informatics 2017, 2 (2), 61-68
- A graphical classification of European countries according to physical activity level of its citizens. D Ríos, T Monleón Getino, M Cubedo Culleré, M Ríos Alcolea.Open Access Library Journal, 2016, vol. 3, num. 12, p. e3195
- Reflexiones sobre la importancia de la enseņanza de las matemáticas y la estadística. Recopilación. 2016. AM GETINO. Lulu. com
- Diseño y planificación de estudios científicos: Calidad de datos (data management) y principios de diseño exerimental. AM GETINO 2017. Lulu. com
- World Health Organization. Coronavirus disease (COVID-2019) situation reports. https://www.who.int/emergencies/diseases/novel-coronavirus-2019/situation-reports
- Brown E. Data2019nCoV: Data on the covid-19 outbreak. 2020.
- Xu B, Gutierrez B, Hill S et al. Epidemiological Data from the nCoV-2019 Outbreak: Early Descriptions from Publicly Available Data. 2020.
- Cori A. EpiEstim: Estimate time varying reproduction numbers from epidemic curves. 2019. https://CRAN.R-project.org/package=EpiEstim
- Thompson R, Stockwin J, Gaalen R van et al. Improved inference of time-varying reproduction numbers during infectious disease outbreaks. Epidemics 2019;29:100356. doi:https://doi.org/10.1016/j.epidem.2019.100356
- Nishiura H, Linton NM, Akhmetzhanov AR. Serial interval of novel coronavirus (2019-nCoV) infections. medRxiv Published Online First: 2020. doi:10.1101/2020.02.03.20019497
- Thompson RN. 2019-20 Wuhan coronavirus outbreak: Intense surveillance is vital for preventing sustained transmission in new locations. bioRxiv 2020;1–14.
- Stan Development Team. RStan: The R interface to Stan. 2020.http://mc-stan.org/
- R Core Team. R: A language and environment for statistical computing. Vienna, Austria:: R Foundation for Statistical Computing 2019. https://www.R-project.org/
- Cori A, Ferguson NM, Fraser C et al. A New Framework and Software to Estimate Time-Varying Reproduction Numbers During Epidemics. American Journal of Epidemiology 2013;178:1505–12. doi:10.1093/aje/kwt133
- Wallinga J, Teunis P. Different Epidemic Curves for Severe Acute Respiratory Syndrome Reveal Similar Impacts of Control Measures. American Journal of Epidemiology 2004;160:509–16. doi:10.1093/aje/kwh255
- Imai N, Cori A, Dorigatti I et al. Report 3: Transmissibility of 2019-nCoV. https://www.imperial.ac.uk/media/imperial-college/medicine/sph/ide/gida-fellowships/Imperial-2019-nCoV-transmissibility.pdf
- Park SW, Champredon D, Weitz JS et al. A practical generation-interval-based approach to inferring the strength of epidemics from their speed. Epidemics 2019;27:12–8. doi:https://doi.org/10.1016/j.epidem.2018.12.002
RESEARCH GROUP BIOST3 - UNIVERSITY OF BARCELONA. FACULTY OF BIOLOGY
amonleong@ub.edu http://www.fbg.ub.edu/investigadors/grups-recerca-ub/estadistica-clinica-biodiversitat/
Comentarios
Publicar un comentario